Atmosphere

Decadal-to-Interdecadal Variability and Trend in Reanalyses

Created by hpaek on - Updated on 08/09/2016 11:45

An intercomparison of the global relative angular momentum MR in five reanalysis datasets, including the Twentieth Century Reanalysis (20CR), is performed for the second half of the twentieth century. The intercomparison forms a stringent test for 20CR because the variability of MR is known to be strongly influenced by the variability of upper-tropospheric zonal wind whereas 20CR assimilated only surface observations. The analysis reveals good agreement for decadal-to-multidecadal variability among all of the datasets, including 20CR, for the second half of the twentieth century. The discrepancies among different datasets are mainly in the slowest component, the long-term trend, of MR. Once the data are detrended, the resulting decadal-to-multidecadal variability shows even better agreement among all of the datasets. This result indicates that 20CR can be reliably used for the analysis of decadal-to-interdecadal variability in the pre-1950 era, provided that the data are properly detrended. As a quick application, it is found that the increase in MRduring the 1976/77 climate-shift event remains the sharpest over the entire period from 1871 to 2008 covered by 20CR. The nontrivial difference in the long-term trend between 20CR and the other reanalysis datasets found in this study provides a caution against using 20CR to determine the trend on the centennial time scale that is relevant to climate change. These conclusions are restricted to the quantities that depend strongly on the upper-tropospheric zonal wind, but the approach adopted in this work will be useful for future intercomparisons of the low-frequency behavior of other climate indices in the reanalysis datasets. Paek and Huang 2012.

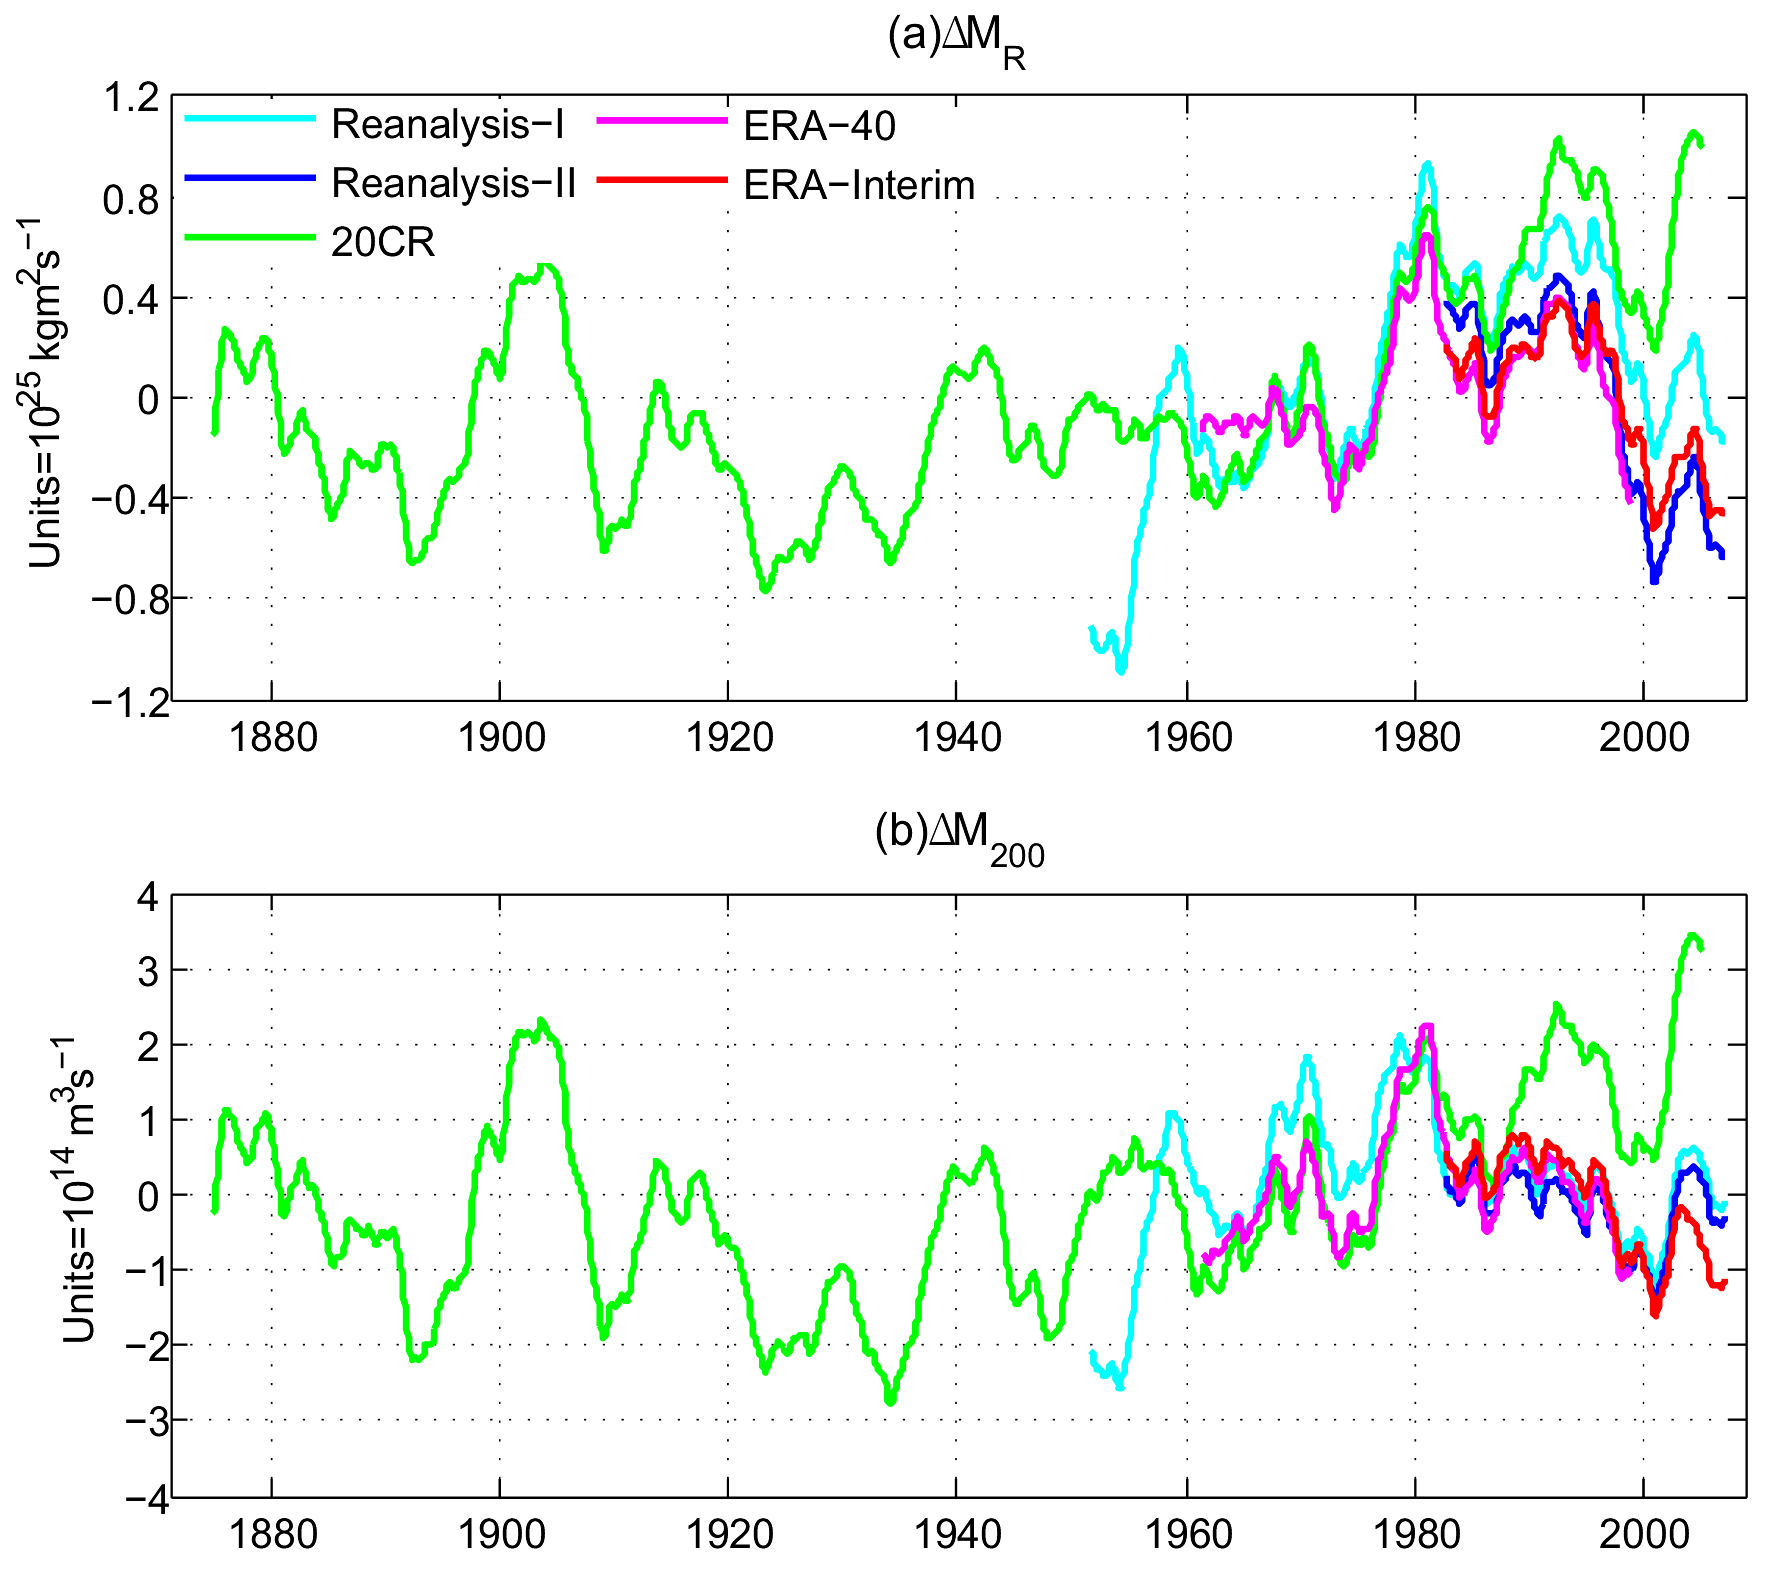
   (a) The 5-year running averaged monthly anomalies of global relative angular momentum, ΔMR, for the 5 reanalysis datasets. (b) Same as (a) but for ΔM200, the angular momentum (per unit pressure thickness) calculated at only 200 hPa level.

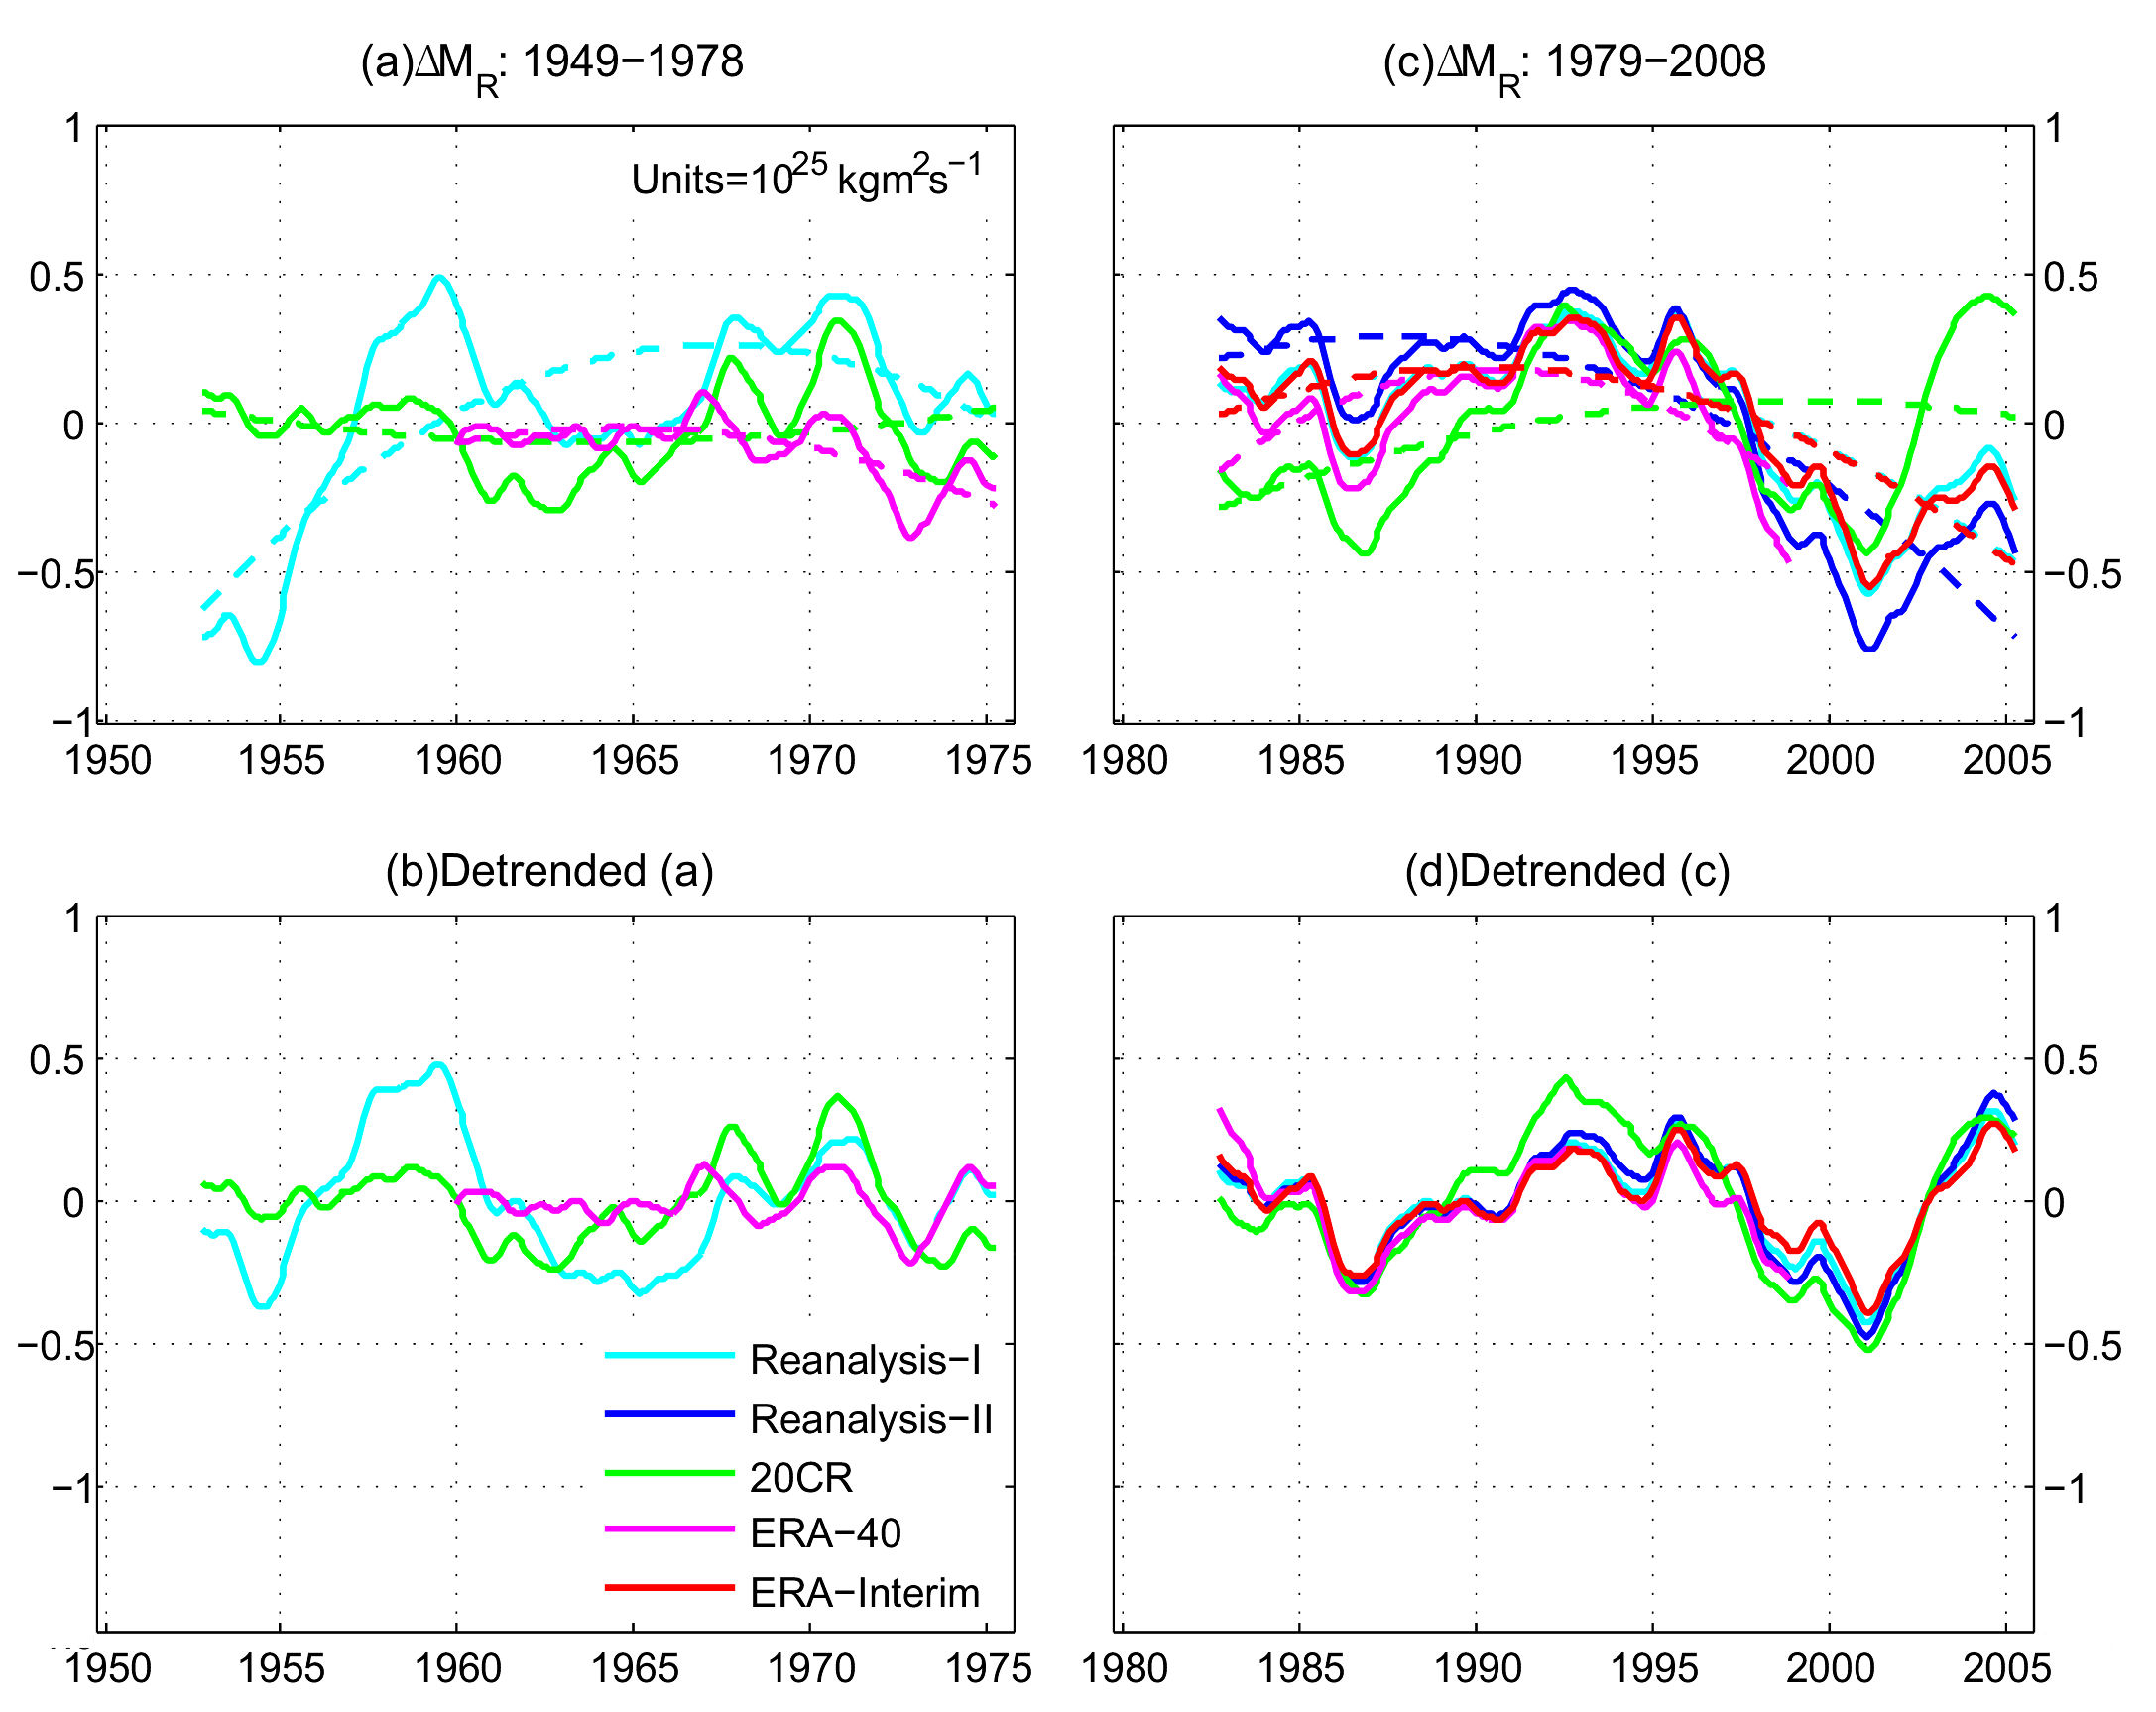
   (a) The least-square quadratic fit (dashed curve) to ΔMR for NCEP Reanalysis I, ERA-40, and 20CR for 1949-1978. (b) the “detrended” time series for the same period, with the quadratic curve removed from the time series. (c) Same as (a) but for 1979-2008 and with the addition of NCEP Reanalysis II and ERA-Interim.  (d) Same as (b) but for 1979-2008 and with the addition of NCEP Reanalysis II and ERA-Interim.

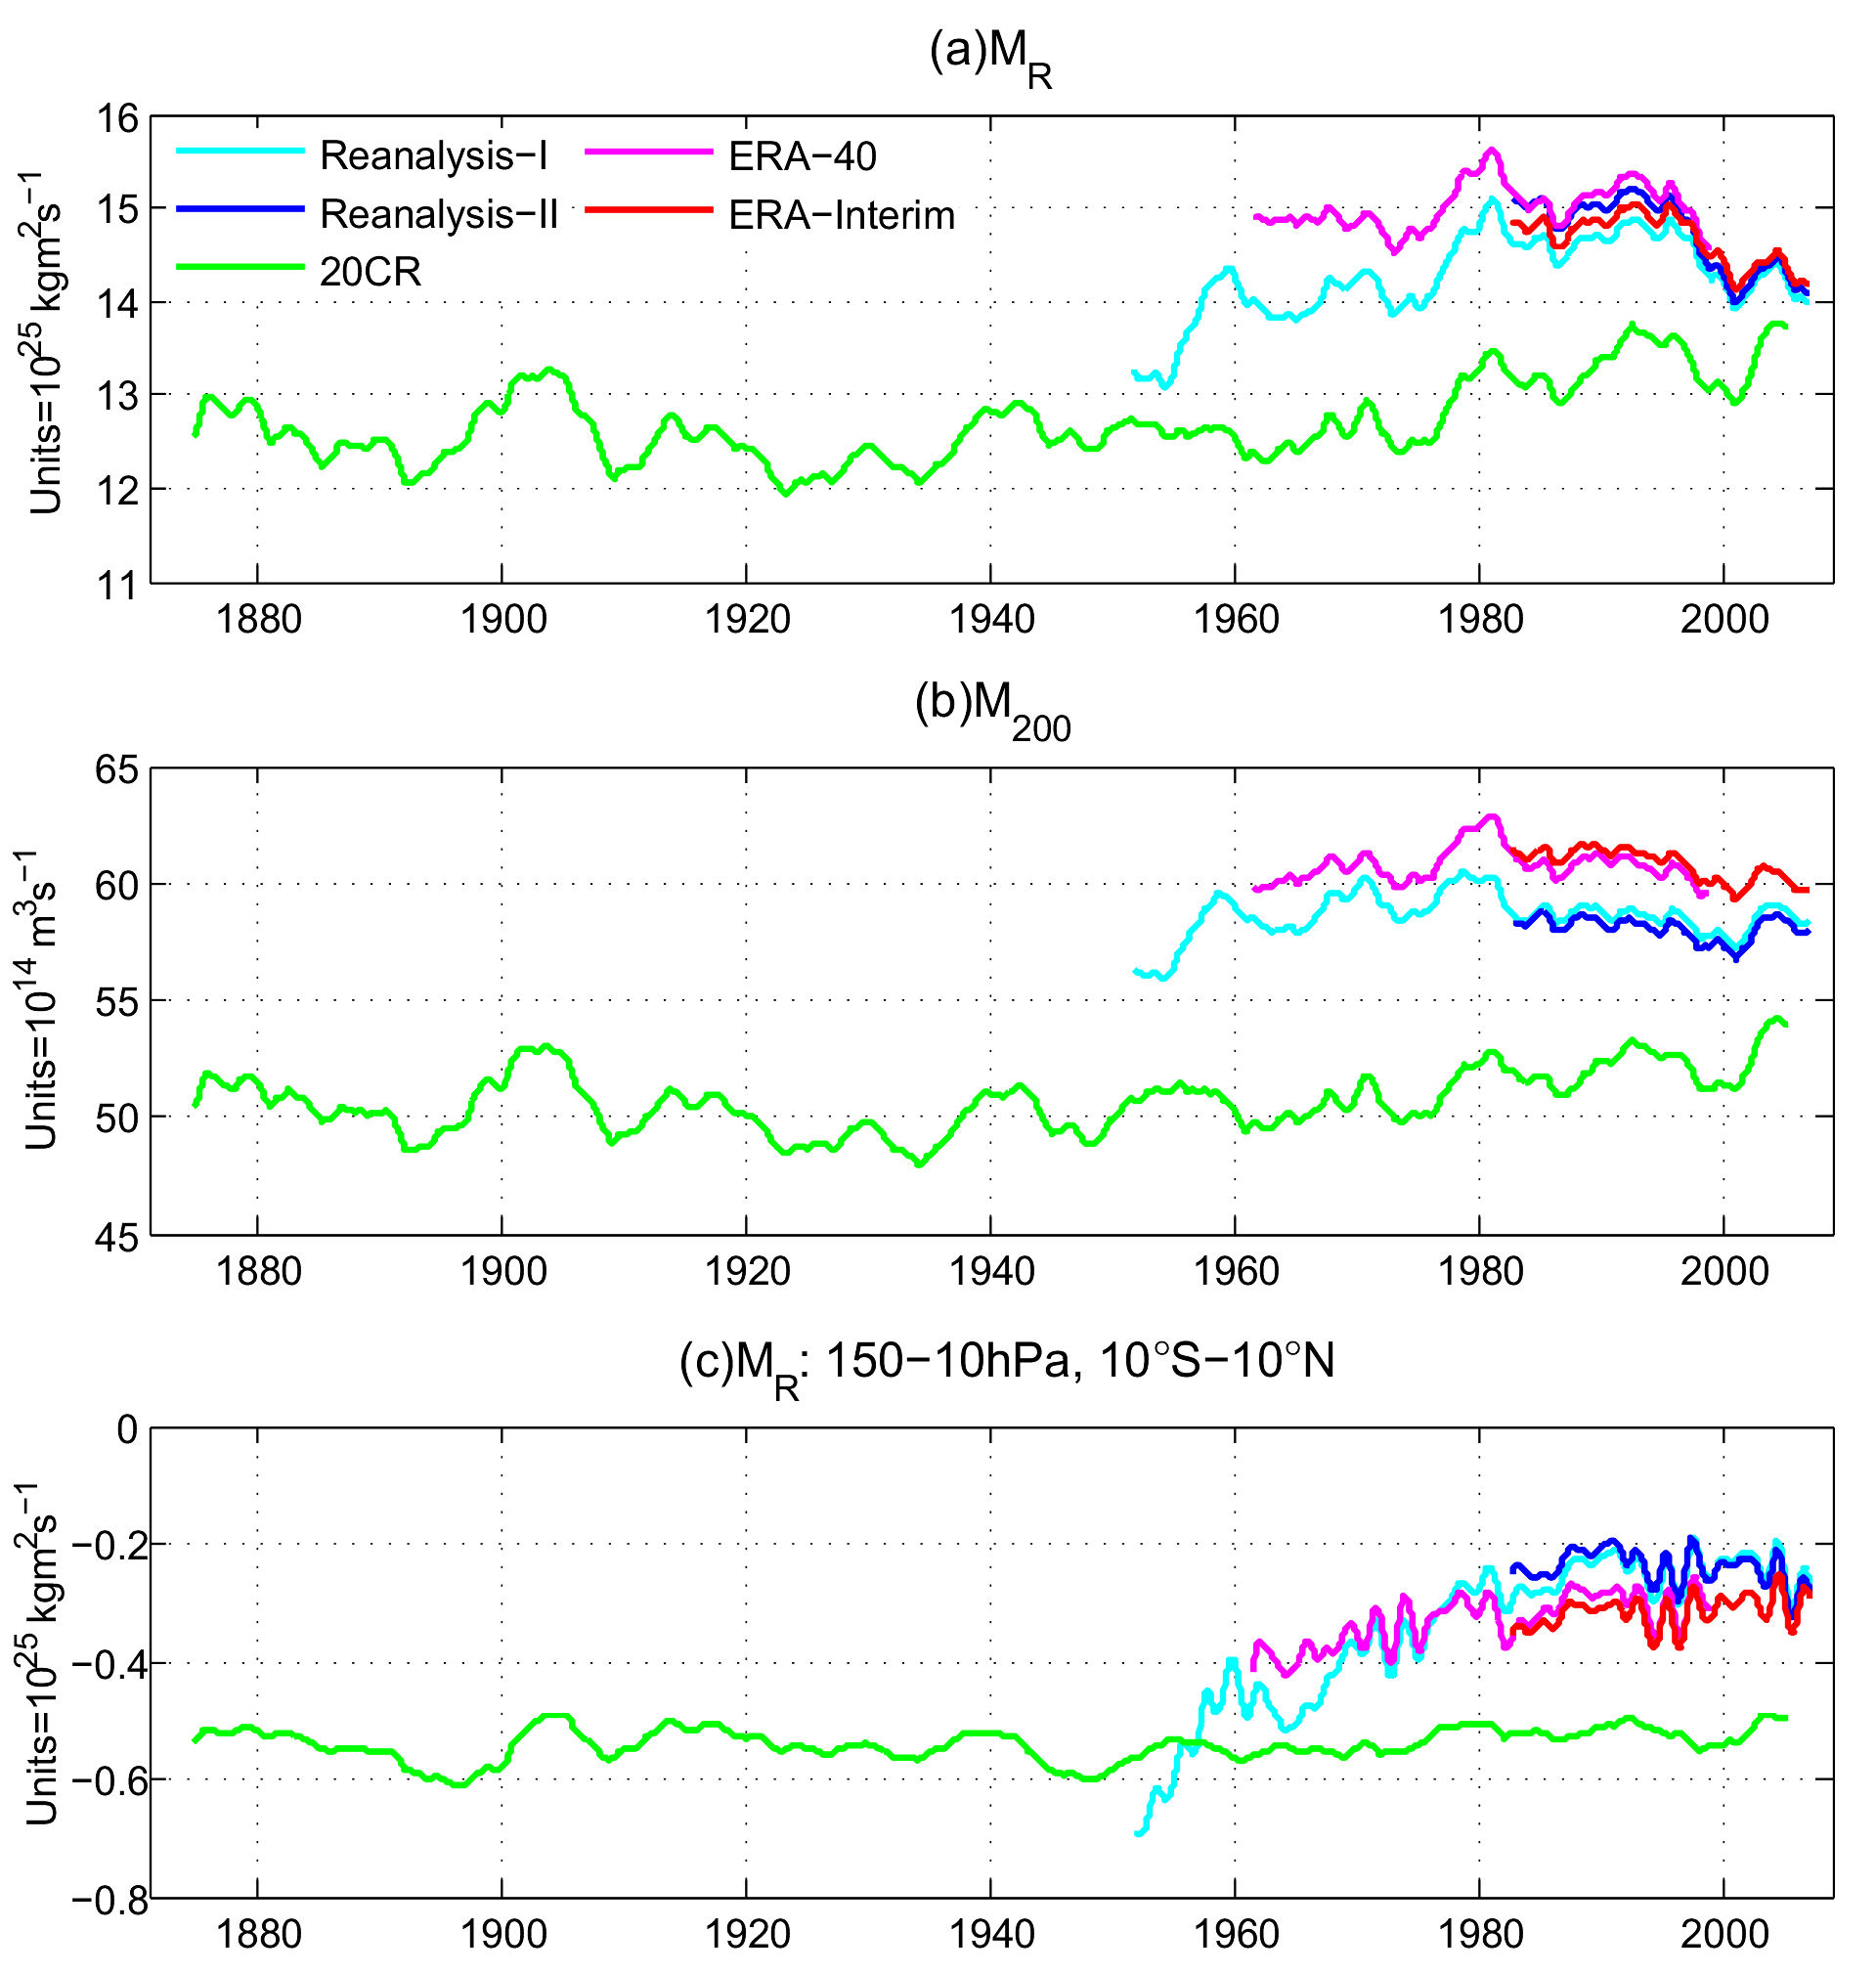
  (a) The global relative angular momentum, MR, with the long-term mean retained, for the five reanalysis datasets. (b) Same as (a) but for M200.  (c) Same as (a) but with the integration carried out only from 150-10hPa and 10°S-10°N to show the contribution from tropical upper atmosphere.

  (a) The summer (JJA)  climatology of zonal mean zonal wind from 1979-2008 for 20CR. (b) Same as (a) but for ERA-Interim. (c) The difference between 20CR and ERA-Interim, i.e., (b) minus (a). (d) is similar to (c) but for the difference between NCEP Reanalysis II and ERA-Interim.  (e)-(h) are similar to (a)-(d) but for winter (DJF). (i)-(l) are similar to (a)-(d) but for the annual mean.  (m) and (n) are the 1979-2008 linear trends for 20CR and ERA-Interim.  Contour intervals are 4 m s-1 for (a), (b), (e), (f), (i), and (j);  1 m s-1 for (c), (d), (g), (h), (k), (l), (m) and (n).

The extended intercomparison to CFSR and MERRA can be found at http://icr4.org/posters/Paek_AT-43.pdf.

Add new comment

CAPTCHA
This question is for testing whether or not you are a human visitor and to prevent automated spam submissions.

Comparing CFSR's tropospheric variability with other reanalyses

Created by muthuvel.chelliah on - Updated on 07/18/2016 10:13

Chelliah, M., W. Ebisuzaki, S. Weaver, and A. Kumar, 2011: Evaluating the tropospheric variability in National Centers for Environmental Prediction's climate forecast system reanalysis, J. Geophys. Res., 116, D17107, doi:10.1029/2011JD015707.

The National Centers for Environmental Prediction (NCEP) recently completed the latest, and partially coupled, atmosphere/ocean/sea-ice model based climate forecast system reanalysis (CFSR) for the 1979-current satellite era. In the reanalysis, the observed CO2 concentration, and the volcanic aerosols were also prescribed. This paper provides an initial overview of the tropospheric variability in the CFSR by comparing it against available previous reanalyses. CFSR data from 1979-current was generated in six independent and parallel streams covering different periods with a one year overlap between streams. CFSR’s monthly mean zonal and meridional component of wind, U and V, temperature T and geopotential height H at pressure levels up to 100 mb are compared against those of three other readily available reanalyses NCEP/R1, NCEP/R2 and ERA40 for the period from 1979 to 2008 (2002 for ERA40) and also against modern reanalyses such as JRA, MERRA and C20.

Correlation time series of monthly mean CFSR’s H, T, U and V, averaged over the globe at pressure levels up to 100 mb as compared to the R1, R2 and ERA40, show values as high as 0.95 - 0.99 throughout the period from January 1979 till December 2008 and display a gradual increase with time. This demonstrates that the CFSR tropospheric analyses are closer to the other three analyses in the later years than in the previous years. The impact of the assimilation of ATOVS satellite radiances from October 1998 onwards in CFSR is the most likely cause for the agreement with other reanalyses. This is also reflected in the generally higher root mean square (rms) difference values of CFSR with respect to the other reanalyses in the earlier periods which slowly decreases to lower rms values in the later periods at all pressure levels and for all variables considered. Even though the high correlations of CFSR tropospheric variables with R1/R2/ERA40 reanalyses do not show any significant impact of the CFSR data generation in multiple streams, examination of rms maps do show some impact.

While the agreement among all the other reanalyses is relatively better in the later years, during the early period the CFSR 850 mb temperature is colder and hence the 200mb heights are lower than the other reanalyses, particularly before 1998, thus implying a greater trend in CFSR in these and other variables at equatorial latitudes. However, the linear trends of CFSR 850 annual mean T, over the common 1979-2001 period, over the entire globe resemble the ERA40 trends than those of R1 and R2, while the latter two agree better with each other. Over this period, significant differences exist in the tropical east Pacific region, with R1 and R2 showing a cooling trend, whereas CFSR and ERA40 depict a warming trend there and over most regions of the globe as well. At 200 mb, both ERA40, and CFSR show a broad warming trend in the tropics and subtropics over the past 30 years, whereas R1 and R2 show a cooling trend over much of the globe. An examination of time series of some climate indices, such as the various Nino wind indices in the tropical Pacific at 850 and 200 mb suggests that the other reanalysis data sets tend to agree more closely with each other than with CFSR, thus clearly making it an outlier until the late 1990’s. Similar bias in the CFSR temperature field in the near equatorial latitudes is also noted as compared to the other three reanalyses, with CFSR being colder. Consistently, CFSR’s 200 mb heights at the equatorial latitudes are also lower than the other three reanalyses. mb heights at the equatorial latitudes are also lower than the other three reanalyses.

Despite the JRA and MERRA reanalysis monthly mean data sets becoming available toward the completion of this project they were employed to examine the vertical shear (200-850 mb) of the zonal wind from the CFSR over the main hurricane development region (10N-20N, 60W-20W) in the tropical North Atlantic during the peak hurricane season (Aug-Sep-Oct). The CFSR wind shear in the Atlantic MDR is not only lower than R1, R2 and ERA40, but also than that of JRA and MERRA particularly before 1998, thus making CFSR an outlier as compared to all other reanalyses. Interestingly the shear from all five other reanalyses agreed more with each other.

We also found that based on MSLP differences between the tropical Indian and east Pacific tropical oceans, the strength of the Walker circulation in CFSR did not show any noticeable trend. However, consistent with a few previous modeling and observational studies from other reanalysis data sets of a strengthening Walker circulation in a globally warming climate, R1 and R2 reanalyses data did exhibit a minor strengthening and low level increased easterlies from 1979 to 2008. Finally, our lag-correlation analysis and results indicate that the CFSR model and analyses exhibit a better coupling and internal consistency between the model precipitation and low level wind field in its eastward propagation time scales associated with the MJO, thus making any dynamical prediction of MJO events likely to be improved when compared to the NCEP/R1 based reanalysis and model.


In summary, at any given time (analysis hour, daily or month), for the globe as a whole, CFSR analysis agrees reasonably well with the other reanalyses. The CFSR’s new coupled model and assimilation system makes use of the recent advances in these areas, and hence is possibly an improvement to NCEP’s previous reanalyses R1 and R2 which are fifteen and ten years old respectively. For these long-term climate variability measures the analysis indicates that the CFSR was generally the outlier, with much stronger easterly trades, cooler tropospheric temperatures and lower geopotential heights during much of the earlier part of the analysis period (1979 to ~1998). Consequently, real-time monitoring of many of the ENSO related climate wind indices in the equatorial Pacific or the wind shear index in the tropical North Atlantic from CFSR may be problematic in the context of historical variability.

Some Figures from the paper:Figure 7.  (left) Monthly correlations and (right) root-mean-square differences over 90°N–90°S domain. (a) Correlation of CFSR zonal component of wind U with NCEP/R1 zonal component of wind U at all pressure levels up to 100 mb from January 1979 through December 2008. (b) As in Figure 7a except with NCEP/R2. (c) As in Figure 7a except with ERA40. (d) As in Figure 7a except for root-mean-square difference in m/s between CFSR and NCEP/R1. (e) As in Figure 7d except with NCEP/R2. (f) As in Figure 7d except with ERA40.


Figure 12.  (a) Area-averaged 850 mb zonal wind (M/s) in the tropical west Pacific region (5°N–5°S, E-E) for CFSR, NCEP/R1, NCEP/R2 ERA40, JRA, MERRA, and C20. (b) As in Figure 12a except for central Pacific region (5°N–5°S, E-E). (c) As in Figure 12a except for east Pacific region (5°N–5°S, W-W). (d) Area-averaged 200 mb zonal wind (M/s) in the central Pacific region (5°N–5°S, E-W).


Figure 14. (a) August-September-October (ASO) peak season mean vertical zonal wind (U) shear (U200–U850) averaged over the main hurricane development region (10°N–20°N, 60°W–20°W) in the tropical North Atlantic for CFSR, ERA40, JRA, MERRA, NCEP/R1, and NCEP/R2. (b) As in Figure 14a except for the July-August-September (JAS) peak season in the eastern tropical North Pacific (10°N–20°N, 140°W–105°W).


Add new comment

CAPTCHA
This question is for testing whether or not you are a human visitor and to prevent automated spam submissions.

An intercomparison of different cloud climatologies in the Arctic

Created by chernav on - Updated on 08/09/2016 11:45

A recent publication on different Arctic cloud climatologies intercomparison shows a wide spread among observations and reanalyses. Reanalyses generally are not in a close agreement with satellite and surface observations of cloudiness in the Arctic. Several reanalyses show the highest values of total cloud fraction over the central part of the Arctic Ocean but not over the Norwegian Sea and the Barents Sea as observations do. The maximum and minimum of total cloud fraction in the annual cycle are shifted by 1-2 months compared to observations.


December-January-February and June-July-August mean of TCF over the Arctic (north of 60◦N) from different data.


The annual cycle of TCF.


Normalized pattern statistics showing differences among different observational and reanalyses TCF spatial distribution (Taylor diagrams).


Alexander Chernokulsky and Igor I. Mokhov, “Climatology of Total Cloudiness in the Arctic: An Intercomparison of Observations and Reanalyses,” Advances in Meteorology, vol. 2012, Article ID 542093, 15 pages, 2012. doi:10.1155/2012/542093

Add new comment

CAPTCHA
This question is for testing whether or not you are a human visitor and to prevent automated spam submissions.

EURO4M

Created by dale.barker on - Updated on 08/26/2024 13:12

The European Reanalysis and Observations for Monitoring project is a EU funded project that provides timely and reliable information about the state and evolution of the European climate. It combines observations from satellites, ground-based stations and results from comprehensive model-based regional reanalyses. By closely monitoring European climate, climate variability and change can be better understood and predicted.

EURO4M runs from April 2010 to March 2014.

The high-resolution datasets that are produced by the EURO4M project enable us to put observed high-impact weather and extreme events in a long-term historical context. The innovative and tailored products improve the climate change services for society and support adaptation to a changing environment. Whilst EURO4M provides time series showing the changes in climate over time, the project also enables to report in near-real-time during emerging extreme events.

EURO4M is an important building block for GMES (Global Monitoring for Environment and Security), the European initiative for the establishment of a European capacity for Earth Observation. Related projects ahead of a future GMES Climate Service are MONARCH-A , CARBONES and ERA-CLIM .

For further details, visit the EURO4M web-page at http://www.euro4m.eu/


Add new comment

CAPTCHA
This question is for testing whether or not you are a human visitor and to prevent automated spam submissions.

Web-based Reanalysis Intercomparison Tools (WRIT)

Created by Cathy.Smith@noaa.gov on - Updated on 10/28/2021 12:14

Web-based Reanalysis Intercomparison Tools  (WRIT) BAMS article: 

  http://journals.ametsoc.org/doi/abs/10.1175/BAMS-D-13-00192.1

A set of web-based reanalysis intercomparison tools (WRIT) is available from the NOAA Physical Sciences Laboratory and University of Colorado CIRES.


WRIT Maps WRIT Time-series WRIT Correlations WRIT Trajectories WRIT Distributions

The "WRIT" Maps tool allows users to examine 20CR, ERA-Interim, ERA-20C, JRA-55, MERRA, MERRA-2, NCEP R1, NCEP R2, and NCEP CFSR reanalyses datasets. Pressure level data are available for most reanalyses, as well as 5 single level variables including sea level pressure, 2 m air temperature, 10 m winds, precipitation. Maps and pressure-level by longitude and pressure-level by latitude can be generated for monthly means, anomalies, and climatologies. Observational datasets have been made available that can be compared to 2m air temperature and precipitation. These quantities can be differenced between datasets.

Future enhancements include different time scales.

is also available from WRIT. It allows users to examine 20CR, ERA-Interim, ERA-20C, JRA-55, MERRAMERRA-2, NCEP R1,  NCEP R2, and NCEP-CFSR as well as some observational dataset. Users can compare timeseries from different datasets, regions, variables and levels. Distributions, scatter plots, and auto-correlation are also available. Statistics for each timeseries including means, standaed deviations, slope and correlations are provided.

The "WRIT" Trajectory Tool is a new tool available from WRIT. It allows users to plot forward and backward trajectories from different reanalyses (currently NCEP R1, NCEP R2, and 20CR with more planned). Users can plot  the trajectories of one or more levels on a single plot. The output is plotted and is available as netCDF and as KMZ files suitable for Google Earth.

Other analysis products are planned.

Feedback and suggestions are welcome. Please give comments/issues/suggestions in the Post a comment or question below.


Acknowledgments

The Twentieth Century Reanalysis Project (20CR) used resources of the National Energy Research Scientific Computing Center managed by Lawrence Berkeley National Laboratory and of the Oak Ridge Leadership Computing Facility at Oak Ridge National Laboratory, which are supported by the Office of Science of the U.S. Department of Energy under Contract No. DE-AC02-05CH11231 and Contract No. DE-AC05-00OR22725, respectively. Support is provided by the U.S. Department of Energy, Office of Science Innovative and Novel Computational Impact on Theory and Experiment (DOE INCITE) program, and Office of Biological and Environmental Research (BER), and by the National Oceanic and Atmospheric Administration Climate Program Office. Data are freely available from NOAA, NCAR, the IRI, KNMI, and DOE NERSC.

NASA's Modern Era Retrospective analysis for Research and Applications (MERRA) was developed by the Global Modeling and Assimilation Office (GMAO) and produced through NASA's Modeling, Analysis and Prediction (MAP) program, and is freely available from the Goddard Earth Sciences (GES) Data Information Services center (DISC).

NCEP's Climate Forecast System Reanalysis (CFSR) was developed by the Environmental Modeling Center (EMC) and was partially funded through the NOAA Climate Program Office. It is available free to the public from both NCDC and NCAR.

The ERA-Interim reanalysis is being produced by the European Centre for Medium-Range Weather Forecasts (ECMWF) in Reading, UK. ERA-Interim data with near-real time updates are freely available from the ECMWF data server and from the CISL Data Archive at NCAR. 

WRIT contributes to the Atmospheric Circulation Reconstructions over the Earth (ACRE) Initiative.

WRIT is supported in part by NOAA and by the US Department of Energy Office of Science (BER).

Annonimous (not verified)

Sun, 07/14/2024 - 02:40

Hi,

Would you mind referring me where I can find daily temperature data from the period 2012-2022 for the the entire world?

Best wishes,

Kris

Yaren Duygu Atalay (not verified)

Wed, 01/24/2024 - 12:40

Hello, For my master's thesis, I need the wind speed, solar radiation and sunshine hours of the city of Stuttgart in 10-minute periods for the last 5 years. Coould you direct me to access this data please?


Hi

Is there any source for multiyear WRIT reanalysis for water equivalence of snow depth for the Mediterranean region. I have tried your interface for ERA5, JRA55, MERRA databses and the option appears to be frozen and not allowed. I am testing a statistical ANN and Cluster analysis model that I utilized to identify possible approximate seasons for snowfall and severe weather events, it worked well for flood risk and severe weather , however i wish to trry it for snowfall/depth using multiyear analogous months or seasons . Any suggestions/solutions for analogous re-analysis for snowfall risk and depth?


Thank you B y all results and outcomes. 

Warmest Regards

Mohammed Alkhateeb

Anonymous (not verified)

Thu, 03/20/2014 - 16:24

Why only 2 time series maximum? Do you plan to increase that number? Since this tool is for INTER-comparison (not just comparison), I would expect this function to be useful. It would be particularly good to allow users to choose a group of the reanalyses to plot.Whereas this is more difficult to do for 2d plots, time series should allow such intercomparison to be performed easily.

While comparing more than one timeseries would be ideal, in the current implementation of the tool, it would not be possible as the entire timeseries at all gridpoints is read in and that is very large. We would need to process the data one timestep at a time instead to have it work on the server. It is still possible this is too resource intensive for a web tool but but if we are able to get more programming resources, it would be a very nice feature and a higher priority than other new features for time series plots.--Cathy

Cathy.Smith@noaa.gov

Mon, 05/06/2013 - 14:06

When a user selects MERRA pressure level data for time series as one or both of the variables, we now print "Note: MERRA does not interpolate pressure level variables below the surface. Your MERRA timeseries may average "missing" grids. Please check the MERRA maps of the variable to see where this may occur." MERRA maps points to the mapping WRIT page. Is this sufficient? How should we handle pressure level data below the surface? A user could pick a box that has some values below the surface and some not. We could alternatively not allow any comparisons below the surface. We may be able to report average percent of grids in each month available or something like that. Any other ideas?

MERRA 3D atmospheric data were produced without extrapolation to pressure surfaces where the pressure level would be greater than the surface pressure (in other words, under ground). The impact that this has on averaging is discussed here:

http://gmao.gsfc.nasa.gov/research/merra/pressure_surface.php

A third party routine is available to extrapolate continuous pressure levels.

https://reanalyses.org/atmosphere/extrapolation-merra-reanalyses-obtain…

This would be best applied to 3 or 6 hourly fields.

Gintautas (not verified)

Fri, 11/30/2012 - 12:50

It is a "cool" tool for my students analysing anomalies and compositions, drawing timeseries and trajectories. And all is available without any knowledge in programming, data format or additional data visualisation software. Thanks. Gintas

Anonymous (not verified)

Thu, 08/16/2012 - 15:12

What we could add or change to page: Ability to composite on a set of dates. Allow users to use own dates More variables (what?) Standardized anomalies. We can consider these though they may require too much time to compute. What we hope to improve. Speed! We know where some of the slowness is and hope to find ways around it. Labeling... Please list other suggestions.

Hi,

I am just starting to work with WRIT. It's proving excellent for all sorts of analyses we're doing but one aspect that I'm struggling to undertake is to extract data for specific seasons or a selected run of months. The option to chose a range of months is there on the page but I'm not having any luck getting it to work. Profuse apologies if I'm missing something obvious.


Thanks for providing such great software!


Best wishes, Chris 

Add new comment

CAPTCHA
This question is for testing whether or not you are a human visitor and to prevent automated spam submissions.

Web Based Reanalyses Comparisons

Created by Cathy.Smith@noaa.gov on - Updated on 07/18/2016 10:13

Stuff

Add new comment

CAPTCHA
This question is for testing whether or not you are a human visitor and to prevent automated spam submissions.

The Observations and Analysis

Created by michael.bosilovich on - Updated on 08/11/2016 18:12

An important consideration for analyses or reanalyses is the presence of observations, or the lack thereof. When multiple observations of the same parameter are assimilated, they "compete" to contribute to the analysis. Each observation carries a certain amount of uncertainty, as does the model forecast. The analyzed observations are often reported in observations space, in other words, at the observation location in precise space and time coordinates.  These files are rarely used outside the centers that have developed the reanalyses.

In an effort to facilitate more user interaction with the observations and the analysis, NASA GMAO has produced a gridded data set called the MERRA Gridded Innovations and Observations (GIO) data. The observation-space data has been binned to the native reanalyses grid, so that with an understanding of the reanalysis data format, one could also evaluate the observing system. For example, this data was used to identify a systematic change in a central African radiosonde water vapor that adversely affects MERRA (see Bosilovich et al 2011). These data were also used for a general observing system assessment by Rienecker et al. (2011).

As an example, the following figure shows the RAOB meridional wind forecast bias (OmF) and the analysis bias (OmA) for JJA 1979-2011, area averaged over the central Great Plains states. At first glance, it looks like the radiosondes have an increasing trend in the forecast bias. Consider that the wind profiler network becomes available after 1991 and wind observations from aircraft are more greatly available after 2000. So, the analysis of radiosonde wind observations changes noticeably as more data becomes available.

Time Seris of MERRA OmF OmA for central US meridional wind speed, time averaged for JJA.

 The following three maps show the OmF for meridional wind across the United States for the radiosondes, profilers and aircraft observations. Data are plotted filling the MERRA grid box and provide an idea on the spatial distributions of the observations. The radiosondes and profiler network show that MERRA 6 hour forecasts are underestimating the central plains jet stream.

Radiosone OmF, JJA 02-08 Profile meridional wind OmF JJA 02-08 Aircraft Meridional wind OmF JJA 02-08

Data are available alongside the MERRA data files. Six hourly and monthly frequencies have been produced, all conventional and most radiances are also included. In addition, the data can be accessed through and OpenDAP GrADS Data Server (GDS): http://opendap.nccs.nasa.gov/dods/MerraObs


Add new comment

CAPTCHA
This question is for testing whether or not you are a human visitor and to prevent automated spam submissions.

Analysis of AMIP-20thCv2

Created by Chesley.McColl on - Updated on 07/18/2016 10:13

A set of integrations of the 2008 experimental version of  the NCEP Global Forecast System spectral model was made using as boundary forcing observed sea surface temperatures and sea ice concentration (HadISST interpolated to our T62, approximately 2x2 degree, grid). Observed time-varying CO2, volcanic aerosols, and solar radiative forcing were also prescribed. The integrations used 28 hybrid sigma-pressure levels. 56 ensemble members were integrated in this "AMIP" style.

Timeseries for Anomalies(1873-2008) AMIP & 20CRv2

  1. 2m air temperature

    Precipitable Water

    Precipitation Rate 
  1. global average & land-only global average
  2. regional average of 50N to 50S
  3. regional averages (continental US and Europe) & land only


  1.  

Monthly and annual maps averaged differences [AMIP - 20CRv2] and Anomalies (1873-2008)

2m air temperature (air)

  1. January
    1. 1870's 1880's 1890's 1900's 1910's 1920's 1930's 1940's 1950's 1960's 1970's 1980's 1990's 2000's


    2.  

    3.  

    June

    1870's 1880's 1890's 1900's 1910's 1920's 1930's 1940's 1950's 1960's 1970's 1980's 1990's 2000's

precipitation (prate)(1873-2008)

  1. January
    1. 1870's 1880's 1890's 1900's 1910's 1920's 1930's 1940's 1950's 1960's 1970's 1980's 1990's 2000's


    2.  

    3.  

    June

    1. 1870's 1880's 1890's 1900's 1910's 1920's 1930's 1940's 1950's 1960's 1970's 1980's 1990's 2000's


    2.  

    3.  

precipitable water (pwat)[1873-2008]

  1. January
    1. 1870's 1880's 1890's 1900's 1910's 1920's 1930's 1940's 1950's 1960's 1970's 1980's 1990's 2000's


    2.  

    3.  

    June

    1. 1870's 1880's 1890's 1900's 1910's 1920's 1930's 1940's 1950's 1960's 1970's 1980's 1990's 2000's


    2.  

    3.  

Add new comment

CAPTCHA
This question is for testing whether or not you are a human visitor and to prevent automated spam submissions.

cfsr-references

Created by Cathy.Smith@noaa.gov on - Updated on 07/18/2016 10:13

Saha, Suranjana, and Coauthors, 2010: The NCEP Climate Forecast System Reanalysis. Bull. Amer. Meteor. Soc., 91, 1015–1057.  doi: 10.1175/2010BAMS3001.1 .


Add new comment

CAPTCHA
This question is for testing whether or not you are a human visitor and to prevent automated spam submissions.

ncep-references

Created by Cathy.Smith@noaa.gov on - Updated on 07/18/2016 10:13

Kistler, R., E. Kalnay, W. Collins, S. Saha, G.White, J.Woollen, M. Chelliah, W. Ebisuzaki, M. Kanamitsu, V. Kousky, H. van den Dool, R. Jenne, and M. Fiorino, 1999: The NCEP-NCAR 50-Year Reanalysis: Monthly Means CD-ROM and Documentation. Bull. Amer. Meteor. Soc., 82, 247-267.


Kalnay, E., M. Kanamitsu, R. Kistler, W. Collins, D. Deaven, L. Gandin, M. Iredell, S. Saha, G. White, J. Woollen, Y. Zhu, M. Chelliah, W. Ebisuzaki, W. Higgins, J. Janowiak, K.C. Mo, C. Ropelewski, J. Wang, A. Leetmaa, R. Reynolds, R. Jenne, and D. Joseph, 1996: The NCEP / NCAR 40-year reanalysis project. Bull. Amer. Meteor. Soc., 77, 437-471.


Add new comment

CAPTCHA
This question is for testing whether or not you are a human visitor and to prevent automated spam submissions.