An intercomparison of the global relative angular momentum MR in five reanalysis datasets, including the Twentieth Century Reanalysis (20CR), is performed for the second half of the twentieth century. The intercomparison forms a stringent test for 20CR because the variability of MR is known to be strongly influenced by the variability of upper-tropospheric zonal wind whereas 20CR assimilated only surface observations. The analysis reveals good agreement for decadal-to-multidecadal variability among all of the datasets, including 20CR, for the second half of the twentieth century. The discrepancies among different datasets are mainly in the slowest component, the long-term trend, of MR. Once the data are detrended, the resulting decadal-to-multidecadal variability shows even better agreement among all of the datasets. This result indicates that 20CR can be reliably used for the analysis of decadal-to-interdecadal variability in the pre-1950 era, provided that the data are properly detrended. As a quick application, it is found that the increase in MRduring the 1976/77 climate-shift event remains the sharpest over the entire period from 1871 to 2008 covered by 20CR. The nontrivial difference in the long-term trend between 20CR and the other reanalysis datasets found in this study provides a caution against using 20CR to determine the trend on the centennial time scale that is relevant to climate change. These conclusions are restricted to the quantities that depend strongly on the upper-tropospheric zonal wind, but the approach adopted in this work will be useful for future intercomparisons of the low-frequency behavior of other climate indices in the reanalysis datasets. Paek and Huang 2012.
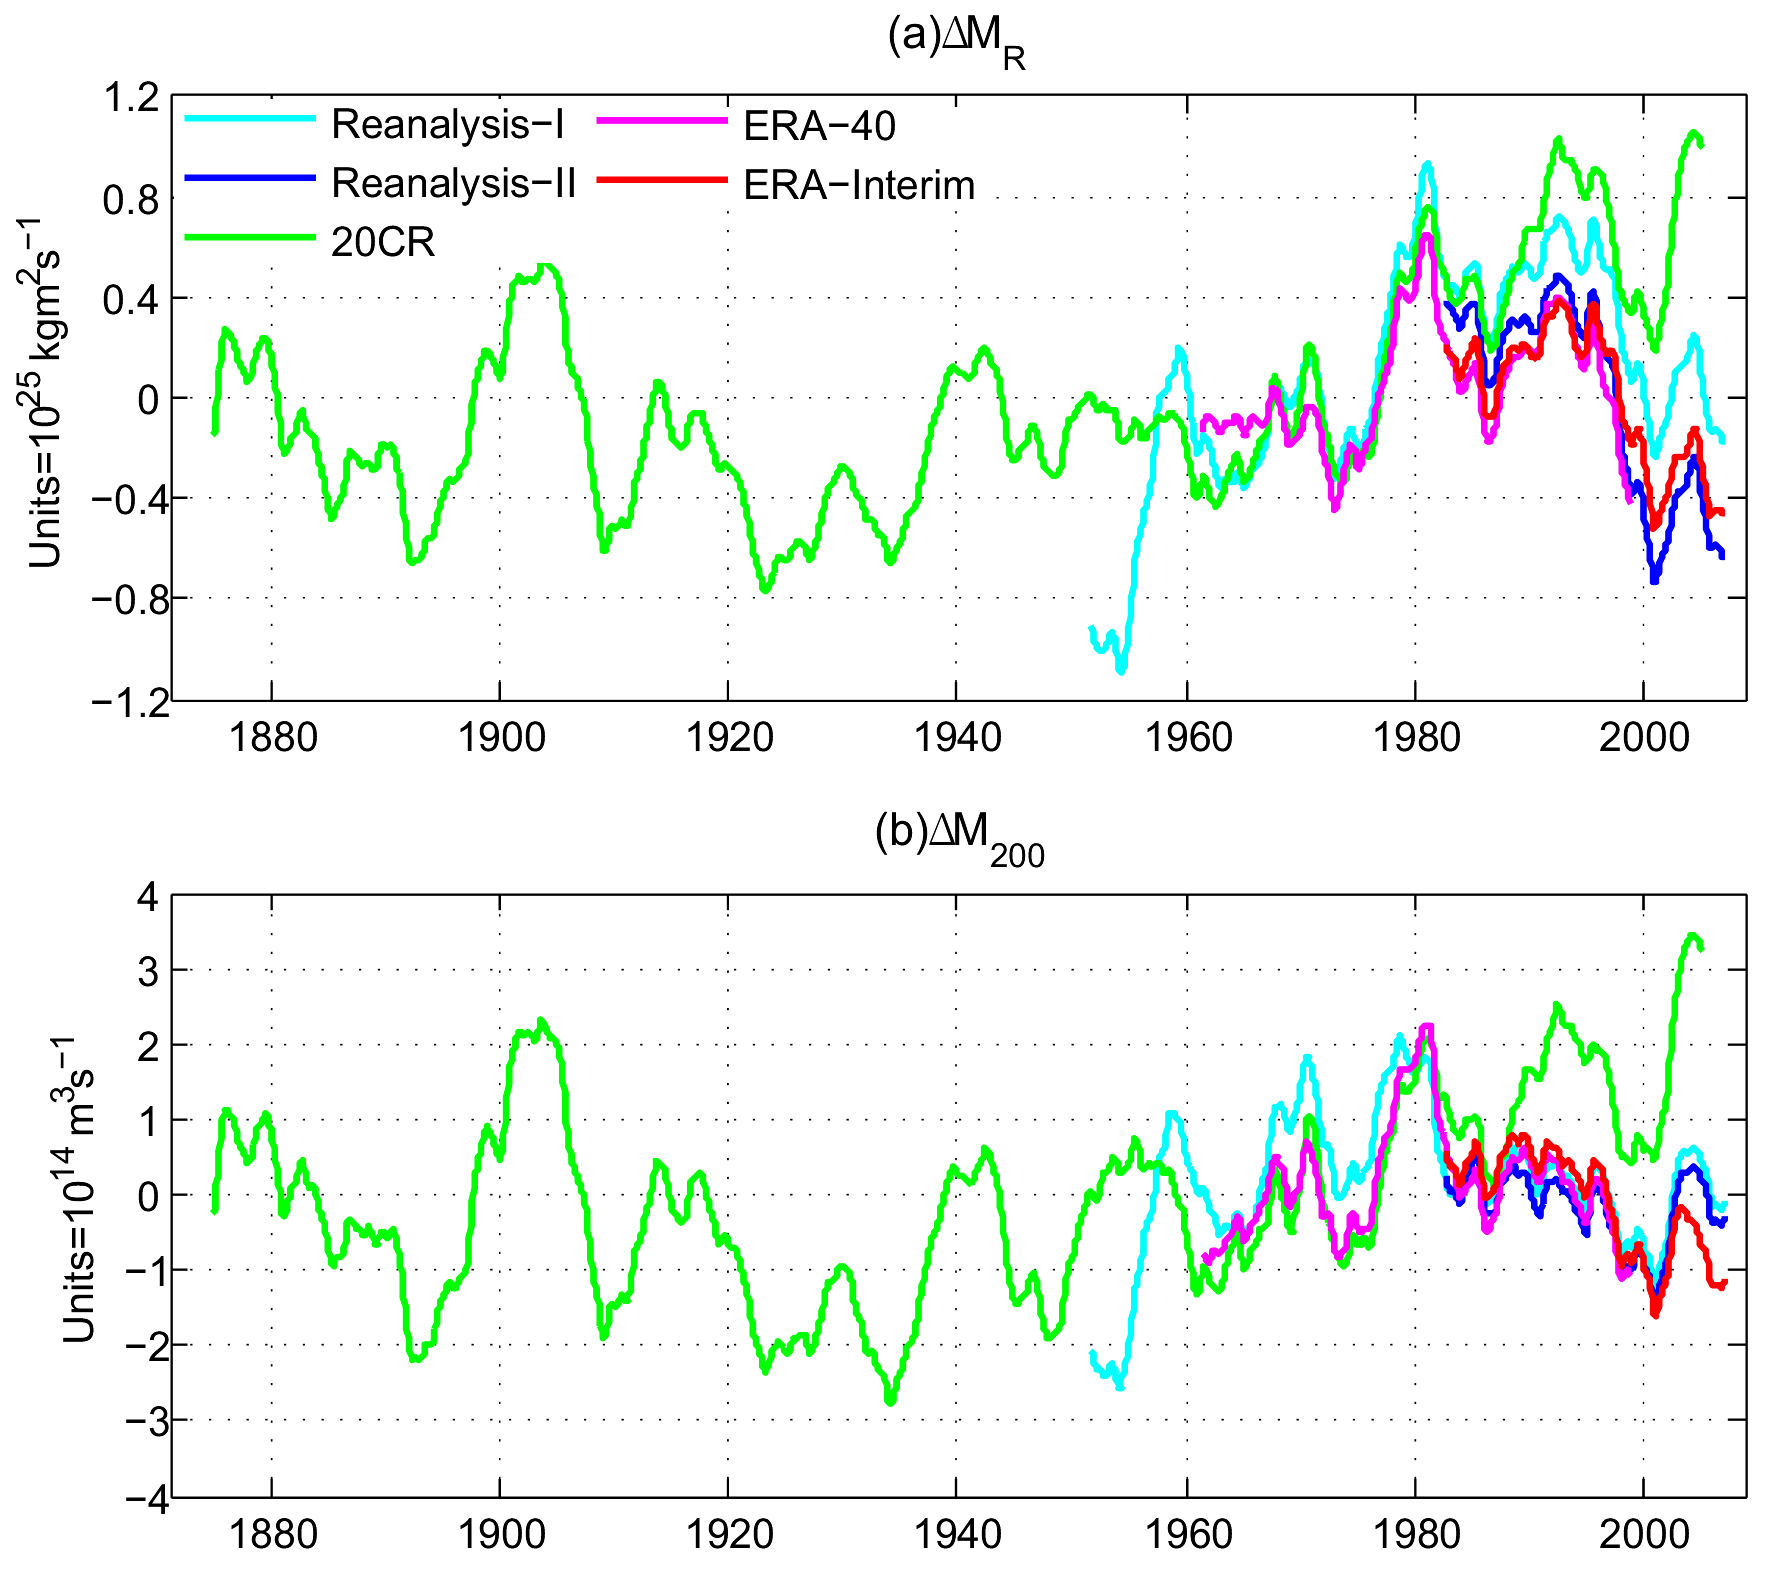 (a) The 5-year running averaged monthly anomalies of global relative angular momentum, ΔMR, for the 5 reanalysis datasets. (b) Same as (a) but for ΔM200, the angular momentum (per unit pressure thickness) calculated at only 200 hPa level.
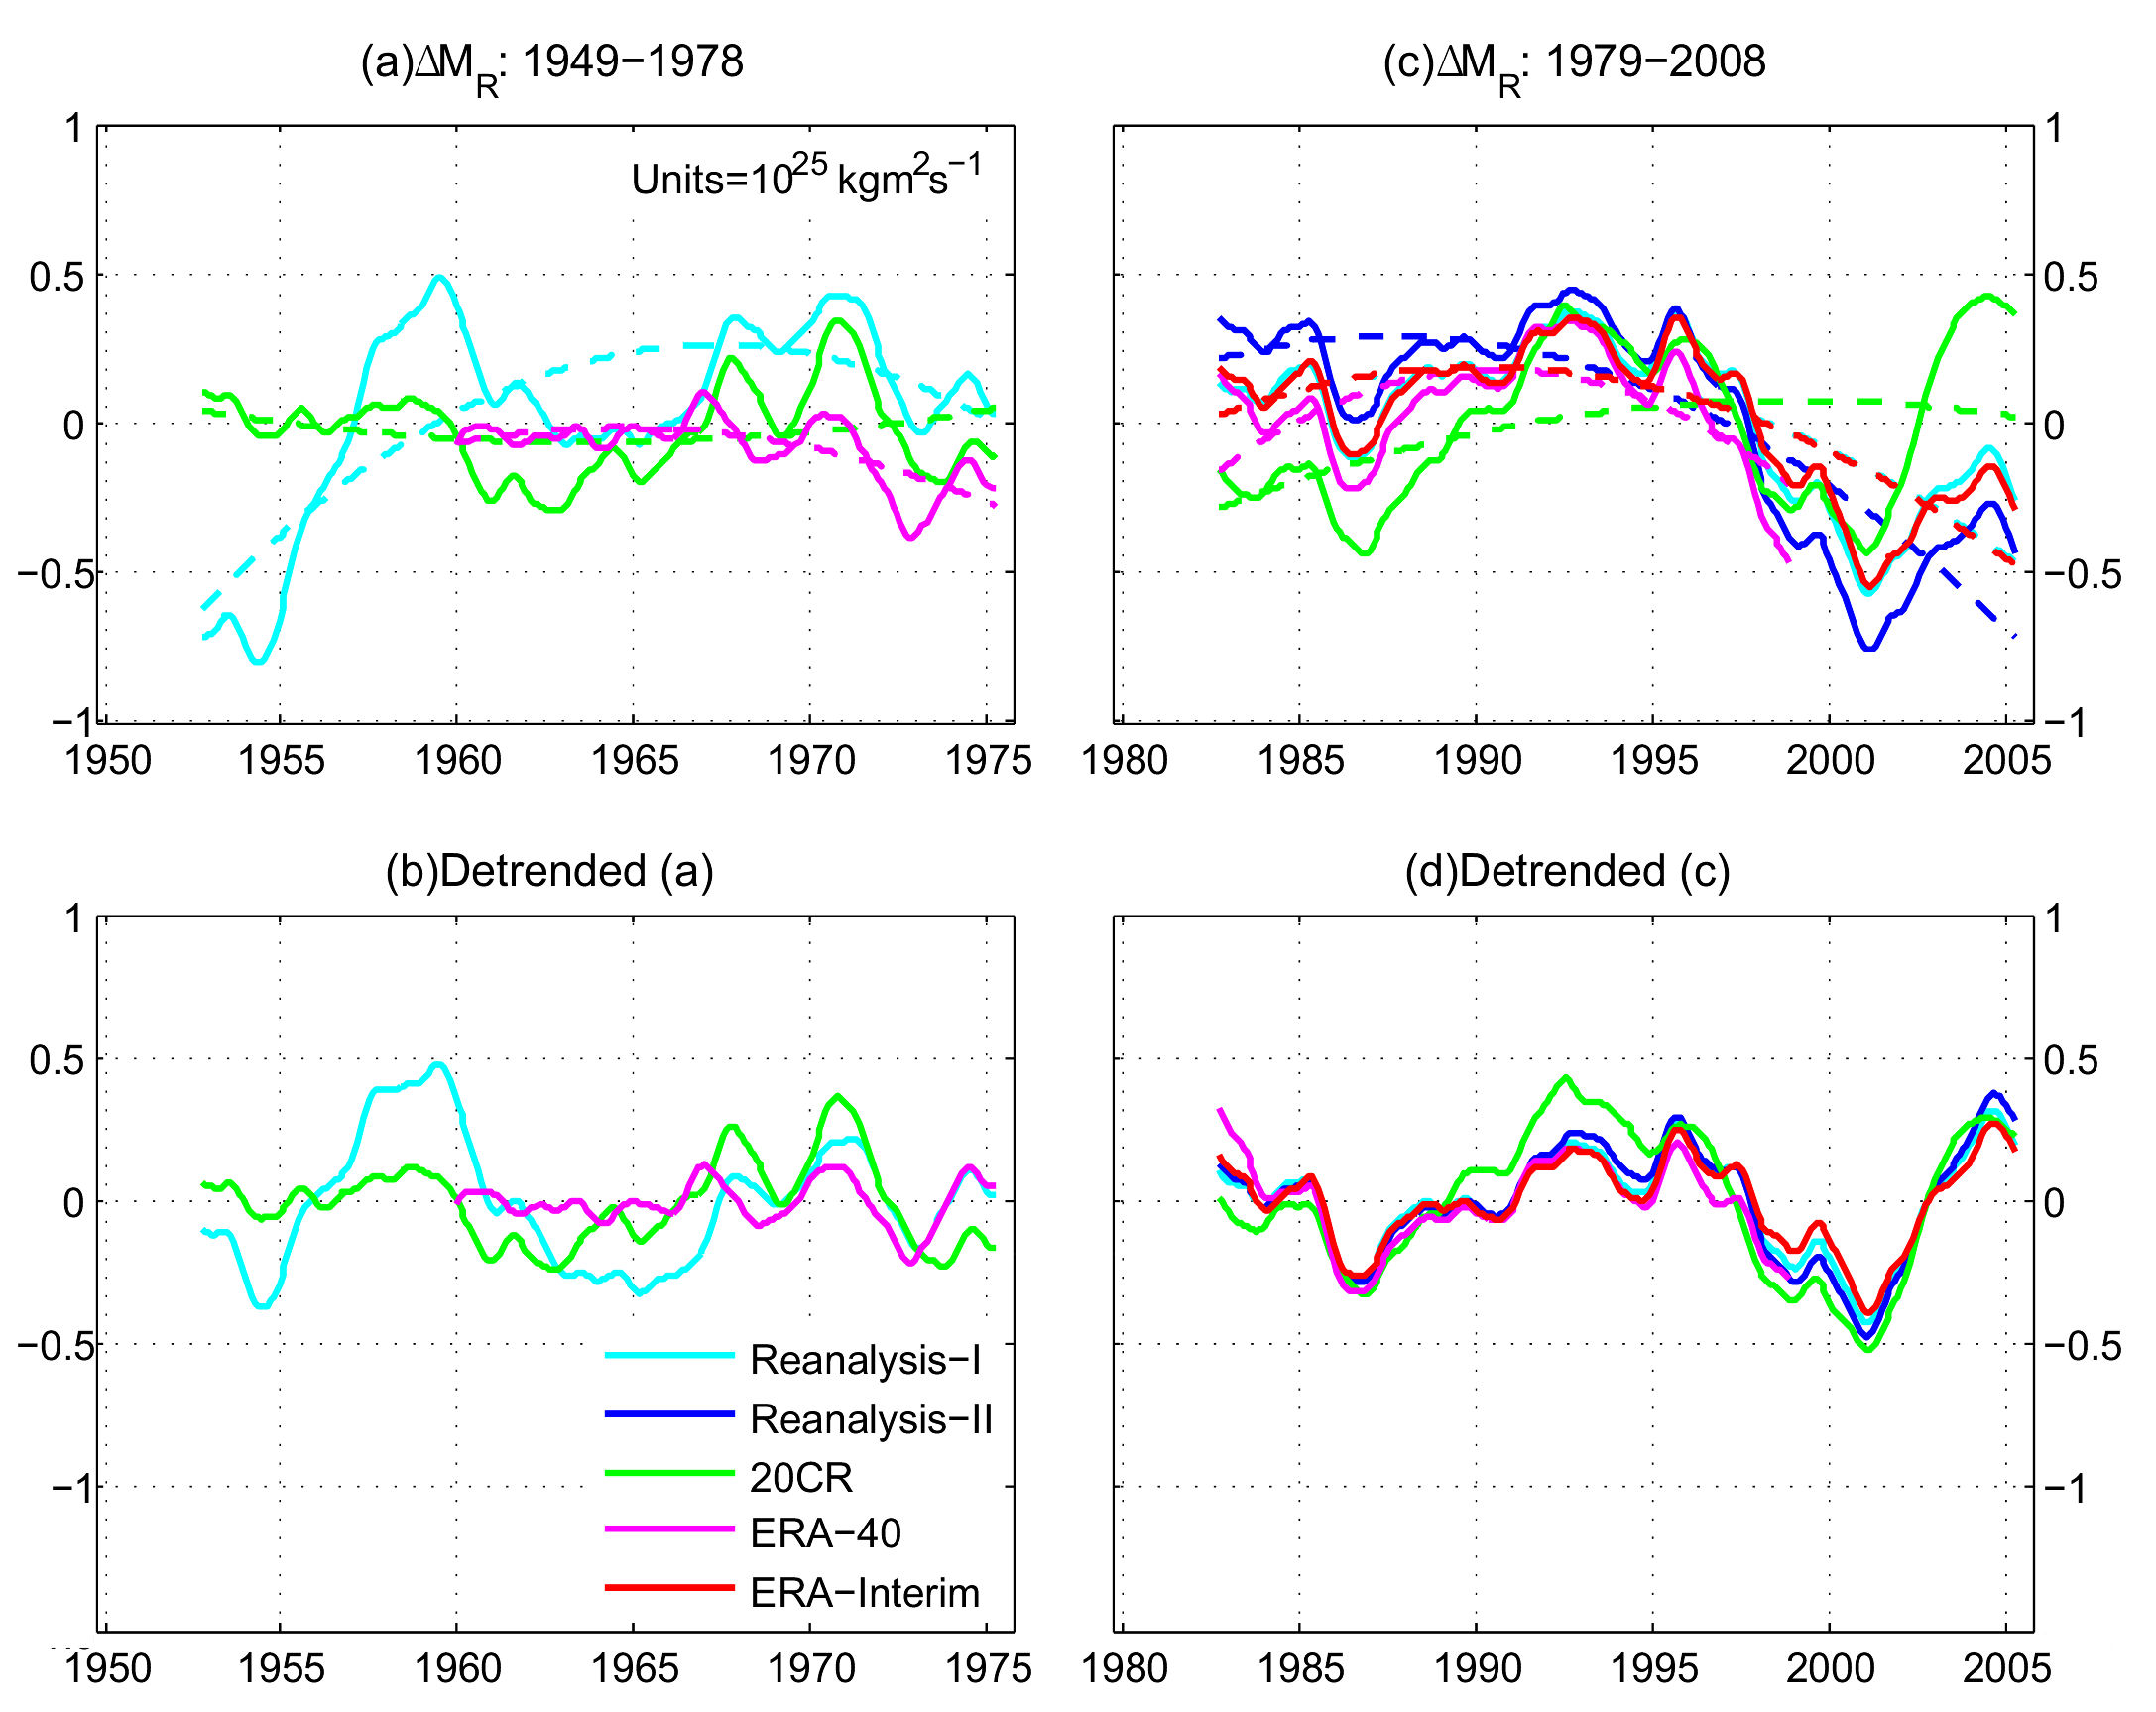 (a) The least-square quadratic fit (dashed curve) to ΔMR for NCEP Reanalysis I, ERA-40, and 20CR for 1949-1978. (b) the “detrended” time series for the same period, with the quadratic curve removed from the time series. (c) Same as (a) but for 1979-2008 and with the addition of NCEP Reanalysis II and ERA-Interim. (d) Same as (b) but for 1979-2008 and with the addition of NCEP Reanalysis II and ERA-Interim.
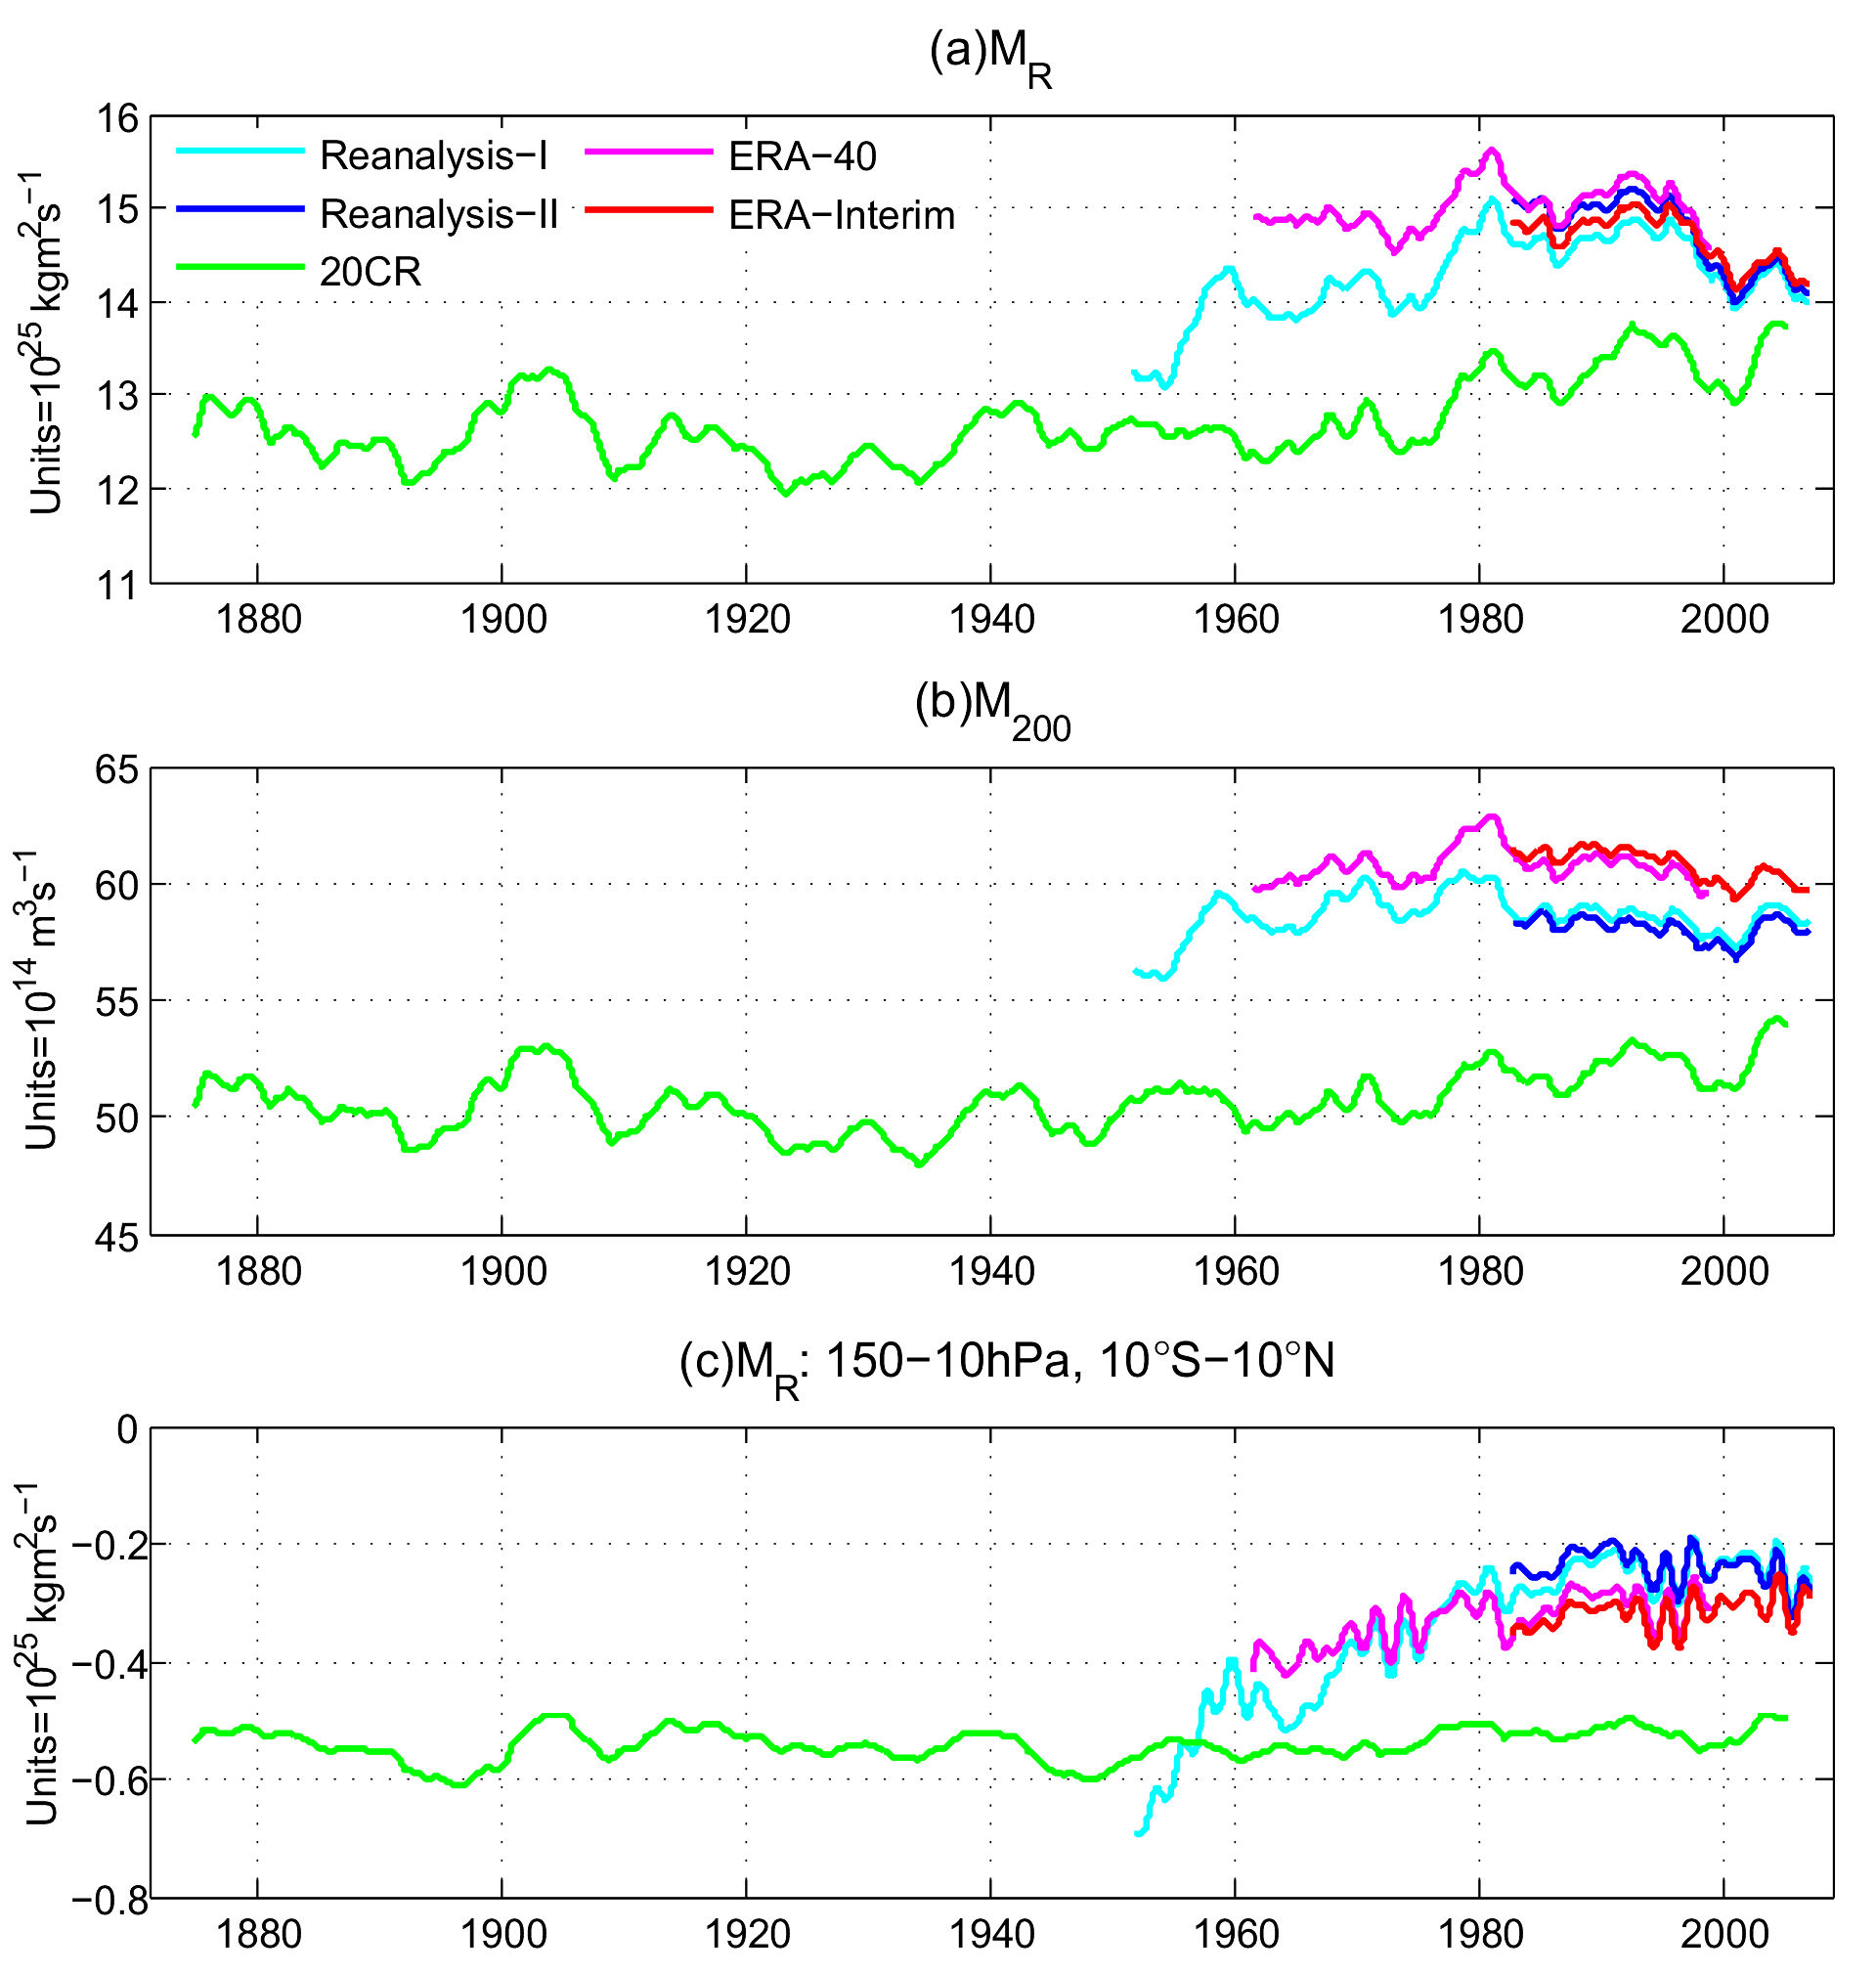 (a) The global relative angular momentum, MR, with the long-term mean retained, for the five reanalysis datasets. (b) Same as (a) but for M200. (c) Same as (a) but with the integration carried out only from 150-10hPa and 10°S-10°N to show the contribution from tropical upper atmosphere.
 (a) The summer (JJA) climatology of zonal mean zonal wind from 1979-2008 for 20CR. (b) Same as (a) but for ERA-Interim. (c) The difference between 20CR and ERA-Interim, i.e., (b) minus (a). (d) is similar to (c) but for the difference between NCEP Reanalysis II and ERA-Interim. (e)-(h) are similar to (a)-(d) but for winter (DJF). (i)-(l) are similar to (a)-(d) but for the annual mean. (m) and (n) are the 1979-2008 linear trends for 20CR and ERA-Interim. Contour intervals are 4 m s-1 for (a), (b), (e), (f), (i), and (j); 1 m s-1 for (c), (d), (g), (h), (k), (l), (m) and (n).
The extended intercomparison to CFSR and MERRA can be found at http://icr4.org/posters/Paek_AT-43.pdf.