RAOBCORE and RICH
online Viewers now available!
RAOBCORE => RAdiosone OBservation COrrection using REanalyses
RICH => Radiosonde Innovation Composite Homogenization
New visualization utility for RAOBCORE and RICH adjusted global radiosonde dataset now available:
RAOBCORE/RICH
Version 1.5.1
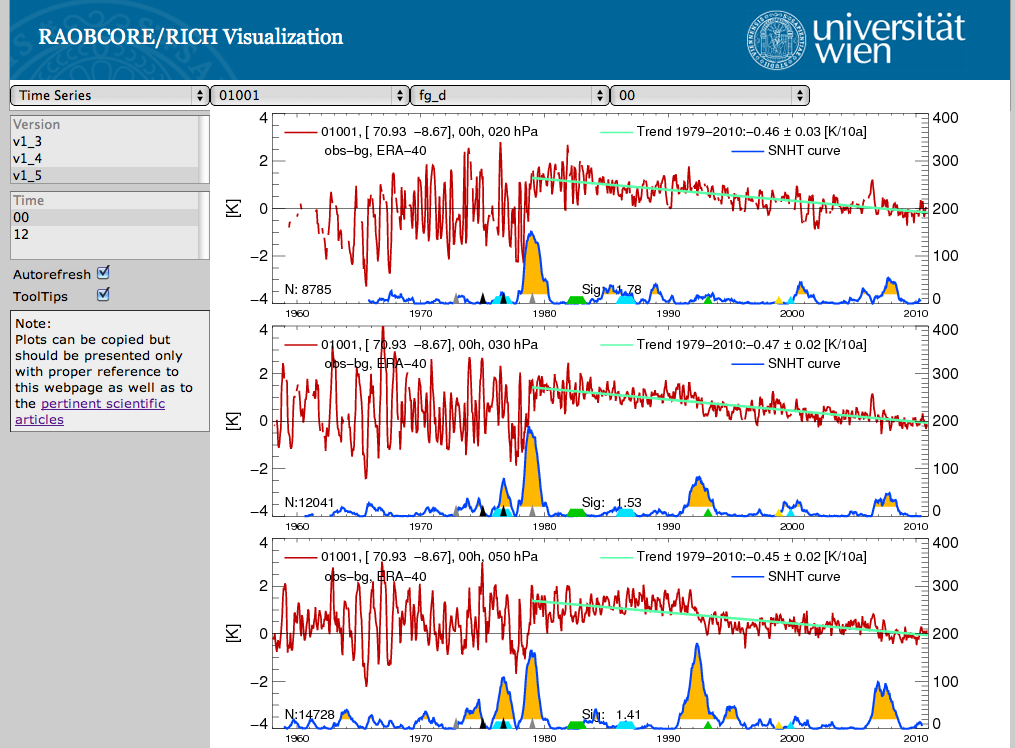
http://srvx7.img.univie.ac.at/~leo/richvis/newindex.html
New visualization utility for RAOBCORE 2.0 global radiosonde dataset now available.
Adjustments are not yet provided.
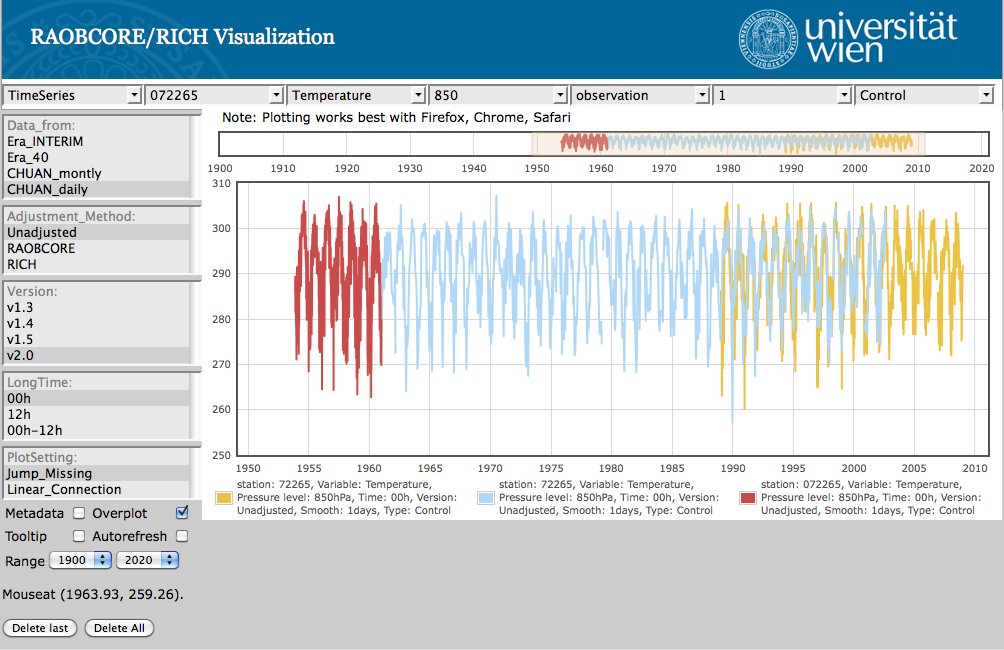
http://srvx7.img.univie.ac.at/~lorenzo/DEVL_rrvis_2.0/html/
Notes: Viewer RAOBCORE 2.0
- Station : WMO radiosonde station number (not all the stations ara available for all the archives)
- Varibale;
- Pressure level [hPa];
- Type: observation, biascorrection (if available), FirstGuess departures (if available) and Analysis departures ( if available);
- Smooth: running mean over the time serie;
- Experiment: only Control is available;
- Data from: in this menu are shown all the possible soure of data we are using:
- Stations_ERA_INTERIM: data from ERA_INTERIM (observations and departures);
- Stations_ERA_40: data from ERA_40 (obseravtiona and departures);
- Stations_CHUAN_montly: monthly data from the CHUAN archive (observations from CHUAN);
- Stations_CHUAN_daily: daily data from the CHUAN archive (observation from CHUAN, Analysis departures from 20CR);
- 20CR: recoverd (only in presence of observation) time series from the 20CR interpolated at the station latitude and longitude;
- ERA_40: recoverd (only in presence of observation) time series from ERA_40 interpolated at the station latitude and longitude;
- long_20CR: recoverd time series (covers all the 20CR length) from the 20CR interpolated at the station latitude and longitude;
- MERGED_archive: it contains merged obseravtions data from ERA_INTERIM, ERA_40 and CHUAN; the analysis departures are from 20CR.
- Adjustment_Method: only Unadjusted is now available;
- Version: only v2.0 is available;
- Long_Time:
- 00h: data at Midnight;
- 12h: data at Noon;
- 00h - 12h: difference between Midnight and Noon;
- PlotSetting:
- Jump_Missing: if there is a missind value, nothing is plotted;
- Linear_Connection: if there is a missing value, a linear connection between the last available and the new available will be plotted;
- Metadata: shows (if available) the metadata for the selected station;
- Overplot: allows plotting many time series on the same frame;
- Tooltip: gives hints about the different menus;
- Autorefresh: at each selection it tries to plot the current setting;
- Range: scaled for the time axis;
- Delete Last: deletes the last plot form the frame;
- Delete All : deletes all the plots from the frame;
In order to zoom in: select with a mouse and drag the area that you would like to inspect. It will be magnified in the main frame.
Suggested stations for a easy start :
- Temperature:
Station: 010393, Merged archive, pressure 1000 or 850 hPa -> long time series back to 1905
Station: 004018, Merged archive, pressure 850 hPa -> continue time serie back to 1946;
- U and V Wind component:
Station: 016716, Merged archive, pressure 200 hPa, Type: Observations and Analysis depertures -> big shift (better visible with smooth bigger than 100);
- Wind Speed:
Station: 016716, Merged archive, pressure 200 hPa, Type: Observations and Analysis depertures -> big shift (better visible with smooth bigger than 100)