20CR

Arctic temperatures in different reanalyses

Created by stefan.broennimann on - Updated on 08/09/2016 11:29

Brönnimann, S., A.N. Grant, G.P. Compo,T. Ewen, T. Griesser, A.M. Fischer, M. Schraner, and A. Stickler, 2012: A multi-data set comparison of the vertical structure of temperature variability and change over the Arctic during the past 100 years. Cli. Dyn., 39, 1577-1598, doi:10.1007/s00382-012-1291-6.

We compare the daily, interannual, and decadal variability and trends in the thermal structure of the Arctic troposphere using eight observation-based, vertically resolved data sets, four of which have data prior to 1948. Comparisons on the daily scale between historical reanalysis data and historical upper-air observations were performed for Svalbard for the cold winters 1911/1912 and 1988/89, the warm winters 1944/1945 and 2005/2006, and the International Geophysical Year 1957/58. Excellent agreement is found at mid-tropospheric levels. Near the ground and at the tropopause level, however, systematic differences are identified. On the interannual time scale, the correlations between all data sets are high, but there are systematic biases in terms of absolute values as well as discrepancies in the magnitude of the variability. The causes of these differences are discussed. While none of the data sets individually may be suitable for trend analysis, consistent features can be identified from analyzing all data sets together. To illustrate this, we examine trends and 20-yr averages for those regions and seasons that exhibit large sea-ice changes and have enough data for comparison. In the summertime Pacific Arctic and the autumn eastern Canadian Arctic, the lower tropospheric temperature anomalies for the recent two decades are higher than in any previous 20-yr period. In contrast, mid-tropospheric temperatures of the European Arctic in the wintertime of the 1920s and 1930s may have reached values as high as those of the late 20th and early 21st centuries.

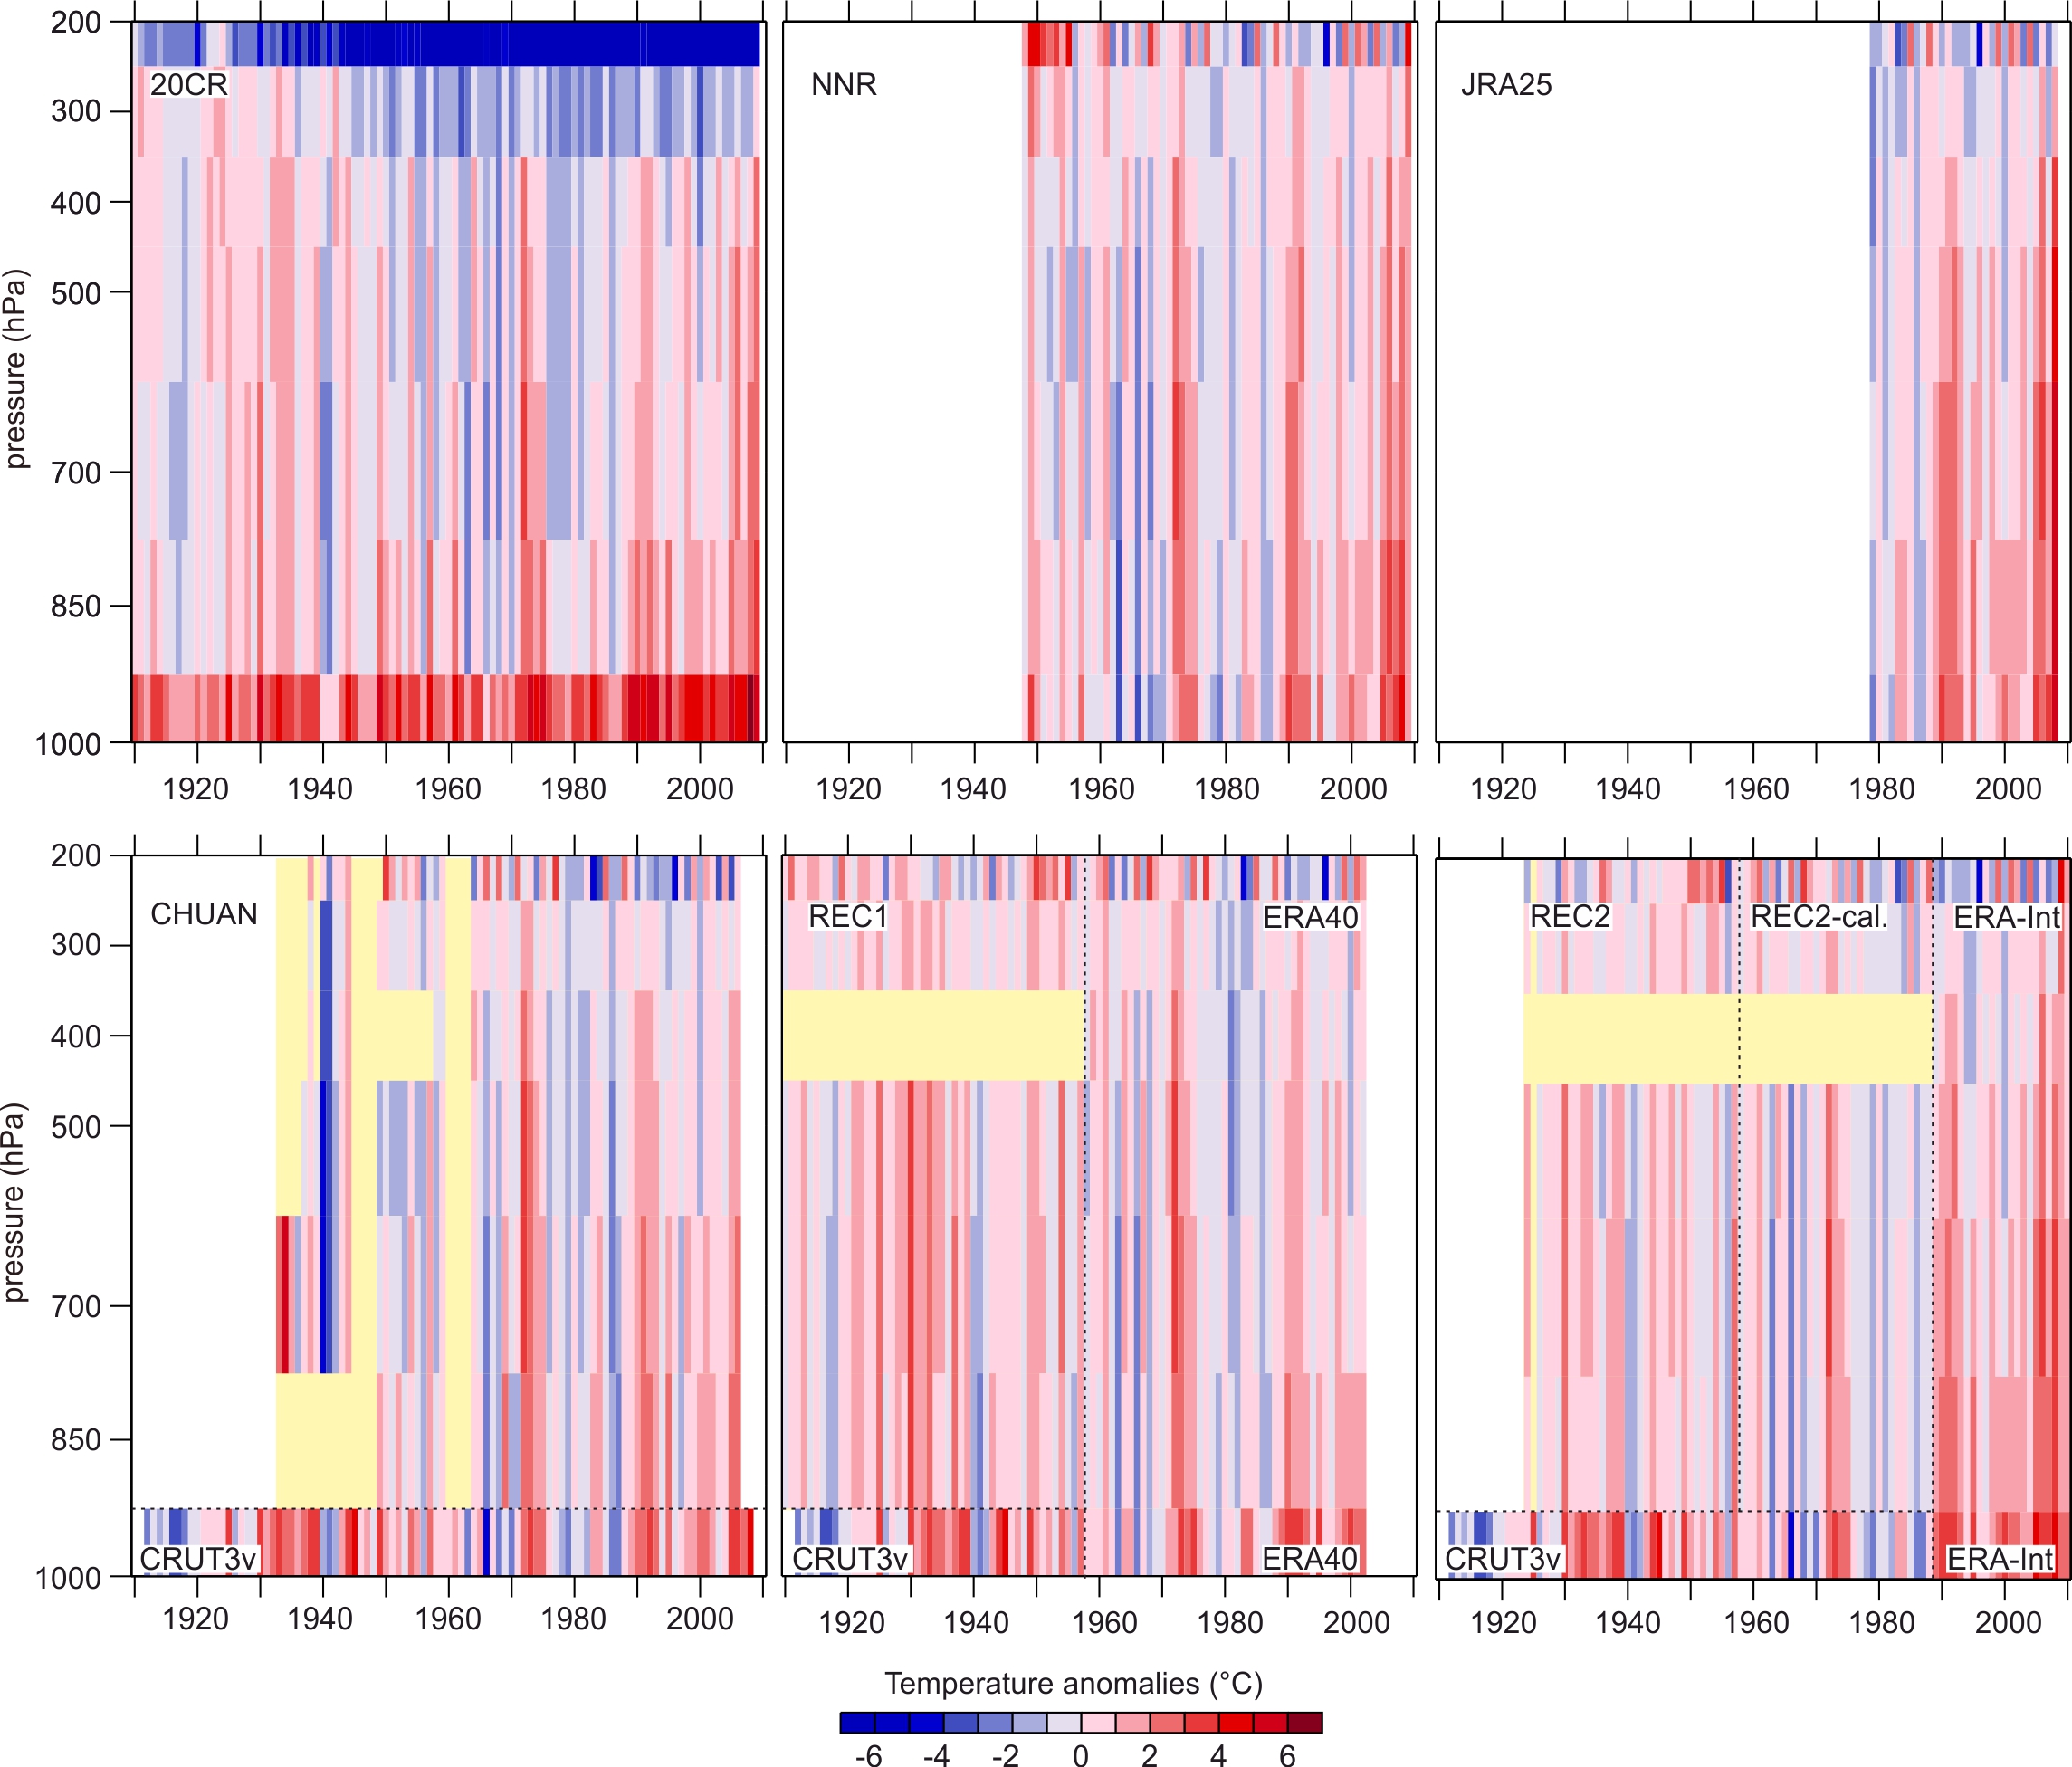
Time-height cross-section of seasonal mean temperature anomalies as a function of pressure and time for different data sets for the European Arctic (see Fig. 2) in winter. All anomalies are with respect to NNR (1961-1990) except CRUTEM3v (self-climatology, see Brohan et al. 2006). Note that for visualisation purposes, non-overlapping data sets have been combined in some cases, indicated by dashed lines). Between the end of the reconstruction period of REC2 (1957) and the start of ERA-Interim (1989) we show the calibration period of REC2. Yellow colours denote missing values.

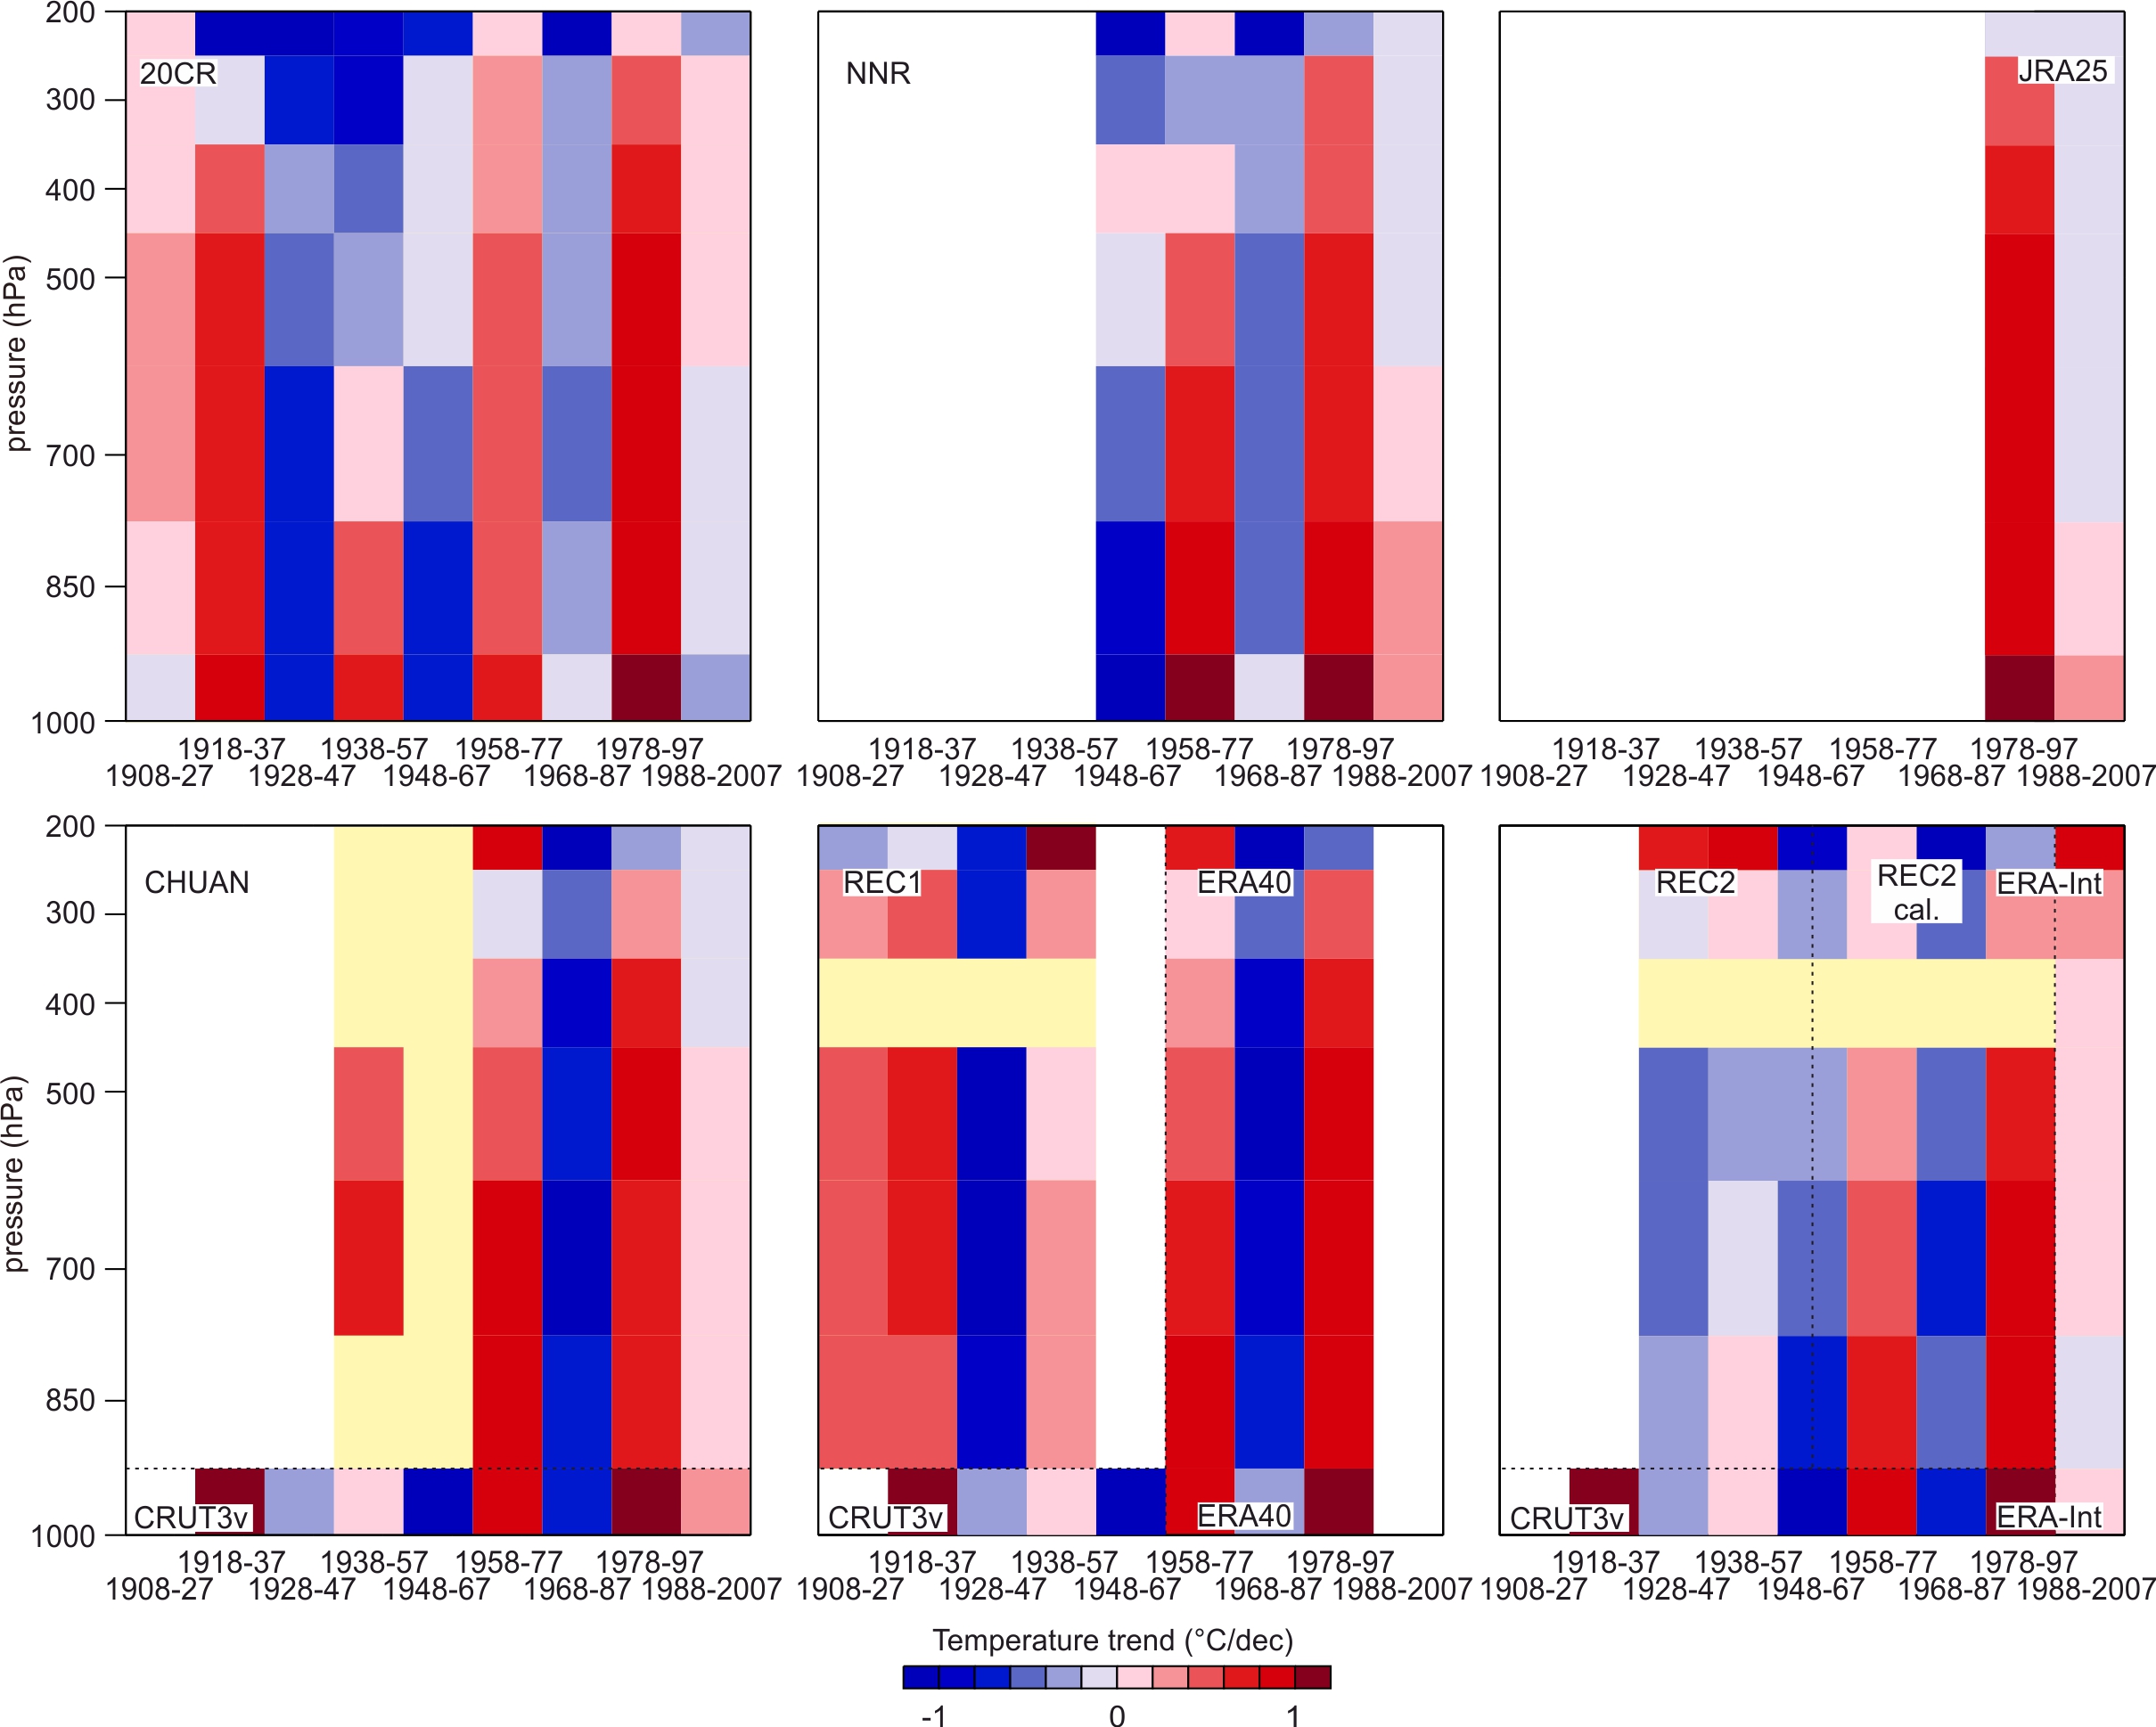
Trend in seasonally-averaged temperature profiles over 20-yr periods as a function of pressure and time period for different data sets for the European Arctic (see Fig. 2) in winter. Note that for visualisation purposes, non-overlapping data sets have been combined in some cases, indicated by dashed lines). Between the end of the reconstruction period of REC2 (1957) and the start of ERA-Interim (1989) we show the calibration period of REC2. Yellow colours denote missing values.

Add new comment

CAPTCHA
This question is for testing whether or not you are a human visitor and to prevent automated spam submissions.

How stationary is the relationship between Siberian snow and Arctic Oscillation over the 20th century ?

Created by yannick.peings on - Updated on 05/17/2017 15:25

Both observational and numerical studies suggest that fall snow cover extent over Eurasia is linked to subsequent winter variations in the predominant Northern Hemisphere teleconnection pattern, known as the Arctic Oscillation (AO). The present study uses the recent 20CR reanalysis to explore the snow-AO relationship over the entire 20th century for the first time. 20CR is first shown to have a consistently realistic simulation of the onset of the Eurasian snow cover compared to a large number of in-situ observations. It is then used to explore the snow-AO relationship over both the satellite and pre-satellite periods. Results show that this teleconnection is not stationary and did not emerge until the 1970's. The possible modulation of the teleconnection by the Quasi-Biennal Oscillation (QBO) is then discussed, as it could have favored the influence of snow anomalies on the Arctic Oscillation in recent decades. These results have important implications for seasonal forecasting and suggest, in particular, that statistical predictions of the wintertime AO should not be based on snow predictors alone.


Reference : Peings Y., E. Brun, V. Mauvais, H. Douville (2013) How stationary is the relationship between Siberian snow and Arctic Oscillation over the 20th century ? Geophysical Research Letters, DOI: 10.1029/2012GL054083.


Figure 1. 20CR snow detection performance: percentage of October days with snow/no snow in both 20CR snow cover and HSDSD data (threshold 5cm) over 1881-1994. b) Difference in % between the 20CR and NSIDC snow detection performance over 1972-1994. c) Observed snow frequency in % of October days over 1972-1994, defined as the ratio of HSDSD data higher than 5 cm.


Figure 2. Timeseries and correlations for the following indices: AO-CPC ; SAI-NSIDC ; SAI-20CR from weekly data over the 1973/74-2006/2007 period. Stars indicate the significance of correlations : ** p<0.01 ; * p<0.05. b) Correlations on a 21-year moving window: AO-CPC vs SAI-20CR; AO-20CR vs SAI-20CR; AO-CPC vs SAI NSIDC; AO-CPC vs SCI-20CR; AO-20CR vs SCI-20CR ;AO-CPC vs SCI NSIDC. The 95% confidence level for correlations is indicated by the horizontal dashed lines. SAI-20CR is computed from daily data


Add new comment

CAPTCHA
This question is for testing whether or not you are a human visitor and to prevent automated spam submissions.

UK winter 1962-3 in 20CR

Created by philip@brohan.org on - Updated on 08/09/2016 11:29

The reanalysis provides us with simultanious estimates of many different variables; so we can make rich reconstructions of particular events, if we can work out how to plot several variables simultaniously. For Snows of Yesteryear, we wanted a visualisation of the UK winter of 1962/3, possibly the coldest in the twentieth century in England and Wales, to provide context and contrast for the documentary accounts of weather impact being collected by the project.

This video shows sea-level pressure (black contours), 10m wind speed and direction (arrows), and 2m temperature anomaly (arrow colours), from the 20th Century reanalysis. The uncertainties for this time and place are small, so we can have confidence in the circulation reconstructions, and we do indeed see the southern UK being dominated by cold easterlies, particularly in January (the coldest month).


To include a video in a page on reanalysis.org:

  1. Put the video up on Vimeo
  2. Click the 'share' icon in the video top right on it's vimeo page (the paper plane - see the video above).
  3. Copy the 'embed' code (text starting '<iframe ').
  4. Edit the reanalysis.org page using the plain text editor.
  5. Paste the copied embed code into the page text at the selected point.

something similar can surely be done with YouTube instead of Vimeo, but I haven't tried.


Add new comment

CAPTCHA
This question is for testing whether or not you are a human visitor and to prevent automated spam submissions.

Interannual Variability in Reanalyses

Created by hpaek on - Updated on 08/09/2016 11:32

Paek, H. and H.-P. Huang (2012), A comparison of the interannual variability in atmospheric angular momentum and length-of-day using multiple reanalysis data sets, J. Geophys. Res., 117, D20102, doi:10.1029/2012JD018105

This study performs an intercomparison of the interannual variability of atmospheric angular momentum (AAM) in eight reanalysis datasets for the post-1979 era.  The AAM data are further cross validated with the independent observation of length-of-day (LOD). The intercomparison reveals a close agreement among almost all reanalysis datasets, except that the AAM computed from the 20th Century Reanalysis (20CR) has a noticeably lower correlation with LOD and with the AAM from other datasets.  This reduced correlation is related to the absence of coherent low-frequency variability, notably the Quasi-biennial Oscillation, in the stratospheric zonal wind in 20CR.  If the upper-level zonal wind in 20CR is replaced by its counterpart from a different reanalysis dataset, a higher value of the correlation is restored.  The correlation between the AAM and the Nino3.4 index of tropical Pacific SST is also computed for the reanalysis datasets. In this case, a close agreement is found among all, including 20CR, datasets. This indicates that the upward influence of SST on the tropospheric circulation is well captured by the data assimilation system of 20CR, which only explicitly incorporated the surface observations.  This study demonstrates the overall close agreement in the interannual variability of AAM among the reanalysis datasets.  This finding also reinforces the view expressed in a recent work by the authors that the most significant discrepancies among the reanalysis datasets are in the long-term mean and long-term trend. Paek and Huang 2012

   The time series of ∆LOD (red curve, converted to an equivalent ∆AAM using Eq. (3)) and ∆AAM (blue curve) from different reanalysis datasets: (a) NCEP R-1, (b) NCEP R-2, (c) CFSR, (d) 20CR, (e) ERA-40, (f) ERA-Interim, (g) JRA-25, and (h) MERRA. The time series of ∆Nino3.4 from HadISST is imposed as the green curve in panel (h). The units for ∆AAM and ∆Nino3.4 are 1025 kg m2 s-1 and 1 °C, respectively. The time series for ∆AAM in panel (e) is slightly shorter due to the shorter record of the ERA-40 dataset.

   The time series of ∆MR,STRAT for four selected reanalysis datasets including 20CR. (b) The original (dark blue) and the modified ∆AAM (light blue) for 20CR. The modified ∆AAM is calculated by replacing the zonal wind in the stratosphere by that from NCEP R-1. See text for detail.  The time series of ∆LOD (converted to an equivalent ∆AAM) is also shown as the red curve. The unit for ∆AAM is 1025 kg m2 s-1.

Add new comment

CAPTCHA
This question is for testing whether or not you are a human visitor and to prevent automated spam submissions.

Report of the 4th World Climate Research Programme International Conference on Reanalyses Discussion Page

Created by gilbert.p.comp… on - Updated on 08/09/2016 11:45
Michael G. Bosilovich NASA/GSFC/GMAO
Michel Rixen, WCRP
Peter van Oevelen, IGPO
Ghassem Asrar, WCRP
Gilbert Compo, NOAA/ESRL
Kazutoshi Onogi, JMA
Adrian Simmons, ECMWF
Kevin Trenberth, NCAR
Dave Behringer, NOAA/NCEP/EMC
Tanvir Hossain Bhuiyan, University of Louisville
Shannon Capps, Georgia Institute of Technology
Ayan Chaudhuri, Atmospheric and Environmental Research, Inc.
Junye Chen, ESSIC NASA/GMAO U. Maryland
Linling Chen, Nansen Environmental and Remote Sensing Center, Norway
Nicole Colasacco-Thumm, University of Wisconsin-Madison
Ma.Gabriela Escobar, Escuela Superior Politécnica del Litoral
Craig R. Ferguson, University of Tokyo
Toshiyuki Ishibashi, JMA IRI
Margarida L. R. Liberato, University of Lisbon
Jesse Meng, NOAA/NCEP/EMC
Andrea Molod, NASA/GMAO/USRA
Paul Poli, ECMWF
Joshua Roundy, Princeton University
Kate Willett, Met Office Hadley Centre
Jack Woollen, IMSG/NOAA/NCEP
Rongqian Yang, NOAA/NCEP/EMC

1. Executive Summary

Reanalyses have become an integral part of Earth system science research across many disciplines. While originating in the atmospheric sciences and Numerical Weather Prediction (NWP), the essential methodology has been adopted in the fields of oceanography and terrestrial ecosystems and hydrology, with emerging research in atmospheric composition, cryosphere and carbon cycle disciplines. Major challenges lie ahead as the disparate nature of each discipline become joined in Earth system analyses. Clearly, substantial progress has been made since the last reanalysis conference (Jan 2008, Tokyo Japan). Newer atmospheric reanalyses (MERRA, CFSR and ERA-Interim) have been evaluated in depth, and many strengths and weaknesses identified. Early results from JRA-55 are becoming available. There is tremendous potential in the NOAA/ESRL 20CR surface data only reanalysis, and in the uncertainty provided from the ensemble. Ensembles of multiple reanalysis systems can provide valuable information. Although there are several reanalyses efforts worldwide at present, the community consensus is that the diversity among them will enable deeper understanding of the reanalyses systems, their strengths and weaknesses and their representation of the underlying earth system processes/phenomena. This is then reflected in the producers’ plans (notably those of JMA and ECMWF) leaning toward “families” of reanalyses (each system producing various configurations of reanalysis). There is much to be learned about the observations, data assimilation, modelling, and coupling the Earth system but new data systems, efficient computing and processing of the multitude of reanalyses products are urgently needed. The integrating nature of reanalyses across components of the Earth system (land, ocean atmosphere) is a key benefit, but to date very few reanalyses systems include all relevant data and assimilate all Earth system components. Observations are the fundamental resource for reanalysis. The need for long-term records of continuous measurements cannot be overstated. Data recovery efforts for in situ and remotely sensed observations are essential to extend the records as far back in time as possible to support long historical reanalyses, while concerted efforts to maintain and develop the observing system forward in time to ensure continuity for the future. Documenting the observations and their uses in past reanalyses can be beneficial both to use in future reanalyses and to understanding of the observations. Expertise for all the observations exists around the world, and so, international coordination of observations for reanalysis should be an imperative for international observations and research coordination programs such as GCOS, GEOSS, CEOS and WCRP. Confronting models with observations continues to be important but also confronting models (e.g. ocean and atmospheric models) and observations (e.g. discrepancies between micro-wave satellite records and radiosonde measurements) among themselves are equally important research tasks for the future. Data assimilation methods continue to improve, but have more challenges ahead, such as the amelioration of shocks associated with changes to the observing system (also better characterizing and reducing model bias) and developing uncertainty estimates for reanalyses. Reanalyses have recently been getting attention from the climate monitoring community, and so, their strengths, weaknesses and uncertainty are increasingly exposed.

Reanalysis users often ask which reanalysis is best for a given topic. As newer reanalyses come along, the answer may not be widely known, if at all. In this regard, the community of users and developers must collaborate, given the diversity of applications. The web site, reanalysis.org, has been promoted as an open media for conveying the latest understanding of reanalyses data. Additionally, NCAR’s Climate Data Guide (https://climatedataguide.ucar.edu/) is a very useful go-to source for scientifically sound information and advice on the strengths, limitations and applications of climate data, including reanalyses. While fundamental information is available primarily on atmosphere and ocean reanalyses, discussions on the latest research and understanding are progressing more slowly. Ultimately, it is incumbent on the researchers to assess the multitude of reanalyses objectively. New data systems are required that allow for more efficient cross comparisons among the various reanalyses (such as those used for AMIP and CMIP studies and the Earth System Grid, ESG). The 4th WCRP International Conference on Reanalyses produced excellent discussions across all the important issues in reanalyses, but continuing the progress and improvements will require sustained efforts over the long term. While progress has been made across the major aspects of reanalyses, significant limitations persist. The conference has identified broad directions to continue the advancement of reanalysis:

1) Quantitative Uncertainty – Reanalyses are based on observations, and can include the errors of observations and the assimilating system. It is recommended to have reanalysis data available in a common framework so as to facilitate the analysis of their strengths and weaknesses. The notion of Families of reanalyses will likewise expose the impact of assimilating observations on the analyses. Ensemble methods can also provide quantitative uncertainty estimates. Lastly, passing observations and innovations into an easily accessible data format can promote deeper investigation of the use of observations in the reanalyses.

2) Qualitative Uncertainty – Often researchers inquire to the applicability of a reanalysis for a given phenomena, or even, which reanalysis is best. Often, this is not satisfactorily known, varies with application and requires significant time and research. Therefore, sharing reanalysis knowledge and research in a timely manner, among researchers and developers is a critical need to allow subsequent exploitation by the climate community. The reanalysis.org effort has provided an initial effort along these lines, but more participation is encouraged. In addition, http://climatedataguide.ucar.edu provides informed commentary on analysis and other datasets. Likely, even more lines of communications are required. 

3) Earth System Coupling – The natural course of reanalysis development is toward, longer data sets with coupled Earth system components that will ultimately contribute to improved coupled predictions. The use of more varied observations (e.g. aerosols) will reinforce the physical representation of the Earth system processes in the reanalysis systems. There is a need to develop independent and innovative modeling, coupling and data assimilation methods to represent the Earth System throughout the time span of the observational record. More interdisciplinary collaborations in the system development and observational research will begin to address this need. 

4) Reanalyses, Observations and Stewardship – While the observational records have been greatly improved since the first reanalyses through research, reprocessing and homogenizations, research and improvements continue their development. Reprocessing and intercalibrations of observed records are critical to improve the quality and consistency of reanalyses. In situ and satellite data need to be found, rescued and archived into suitable formats to extend the reanalysis record back in time. Reanalysis systems for the atmosphere, ocean, cryosphere, land, and coupled earth system are needed that maximize use of the observations as far back as each instrumental record will allow. It is important for the observational data and reanalysis developers to maintain communication, so the latest data are used in reanalyses, and also that output of reanalyses may contribute to the understanding of observations. Such an endeavor should be coordinated at an international level.

 Link to Full Report

Add new comment

CAPTCHA
This question is for testing whether or not you are a human visitor and to prevent automated spam submissions.

Evaluation of Southern African precipitation in reanalyses

Created by qiong on - Updated on 08/09/2016 11:45

Zhang, Q., H. Körnich and K. Holmgren, 2012: How well do reanalyses represent the southern African precipitation? Clim. Dyn., DOI: 10.1007/s00382-012-1423-z.

http://dx.doi.org/10.1007/s00382-012-1423-z

Monthly-mean precipitation observations over southern Africa are used to evaluate the performance of eight global reanalyses: ERA-40, ERA-interim, JRA-25, MERRA, CFSR, NCEP-R1, NCEP-R2 and 20CRv2. All eight reanalyses reproduce the regionally averaged seasonal cycle fairly well; a few spatial mismatches with the observations are found in the climate mean for the rainy season. Principal component analyses show a dipole in the leading modes of all reanalyses, however with crucial differences in its spatial position.

Possible reasons for the differences between the reanalyses are discussed on the basis of the ERA-interim and 20CRv2 results. A comparison between the moisture transports shows that ERA-interim manifests a very strong moisture convergence over the eastern equatorial Atlantic, resulting in the strong precipitation here. This excessive convergence may be due to the water–vapor assimilation and convection parameterization. Over the Indian Ocean, the ITCZ is shifted northward in ERA-interim compared to its position in 20CRv2. This discrepancy is most likely attributable to the meridional SST gradients in the Indian Ocean which are significantly larger in the ERA-interim than those in the 20CRv2, and the resulting atmospheric response prevents a southward shift of the ITCZ.

Overall, the consistent description of the dynamical circulation of the atmosphere and the hydrological cycle appears as a crucial benchmark for reanalysis data. Based on our evaluation, the preferential reanalysis for investigating the climate variability over southern Africa is 20CRv2 that furthermore spans the longest time period, hence permitting the most precise investigations of interannual to decadal variability.


Add new comment

CAPTCHA
This question is for testing whether or not you are a human visitor and to prevent automated spam submissions.

Decadal-to-Interdecadal Variability and Trend in Reanalyses

Created by hpaek on - Updated on 08/09/2016 11:45

An intercomparison of the global relative angular momentum MR in five reanalysis datasets, including the Twentieth Century Reanalysis (20CR), is performed for the second half of the twentieth century. The intercomparison forms a stringent test for 20CR because the variability of MR is known to be strongly influenced by the variability of upper-tropospheric zonal wind whereas 20CR assimilated only surface observations. The analysis reveals good agreement for decadal-to-multidecadal variability among all of the datasets, including 20CR, for the second half of the twentieth century. The discrepancies among different datasets are mainly in the slowest component, the long-term trend, of MR. Once the data are detrended, the resulting decadal-to-multidecadal variability shows even better agreement among all of the datasets. This result indicates that 20CR can be reliably used for the analysis of decadal-to-interdecadal variability in the pre-1950 era, provided that the data are properly detrended. As a quick application, it is found that the increase in MRduring the 1976/77 climate-shift event remains the sharpest over the entire period from 1871 to 2008 covered by 20CR. The nontrivial difference in the long-term trend between 20CR and the other reanalysis datasets found in this study provides a caution against using 20CR to determine the trend on the centennial time scale that is relevant to climate change. These conclusions are restricted to the quantities that depend strongly on the upper-tropospheric zonal wind, but the approach adopted in this work will be useful for future intercomparisons of the low-frequency behavior of other climate indices in the reanalysis datasets. Paek and Huang 2012.

   (a) The 5-year running averaged monthly anomalies of global relative angular momentum, ΔMR, for the 5 reanalysis datasets. (b) Same as (a) but for ΔM200, the angular momentum (per unit pressure thickness) calculated at only 200 hPa level.

   (a) The least-square quadratic fit (dashed curve) to ΔMR for NCEP Reanalysis I, ERA-40, and 20CR for 1949-1978. (b) the “detrended” time series for the same period, with the quadratic curve removed from the time series. (c) Same as (a) but for 1979-2008 and with the addition of NCEP Reanalysis II and ERA-Interim.  (d) Same as (b) but for 1979-2008 and with the addition of NCEP Reanalysis II and ERA-Interim.

  (a) The global relative angular momentum, MR, with the long-term mean retained, for the five reanalysis datasets. (b) Same as (a) but for M200.  (c) Same as (a) but with the integration carried out only from 150-10hPa and 10°S-10°N to show the contribution from tropical upper atmosphere.

  (a) The summer (JJA)  climatology of zonal mean zonal wind from 1979-2008 for 20CR. (b) Same as (a) but for ERA-Interim. (c) The difference between 20CR and ERA-Interim, i.e., (b) minus (a). (d) is similar to (c) but for the difference between NCEP Reanalysis II and ERA-Interim.  (e)-(h) are similar to (a)-(d) but for winter (DJF). (i)-(l) are similar to (a)-(d) but for the annual mean.  (m) and (n) are the 1979-2008 linear trends for 20CR and ERA-Interim.  Contour intervals are 4 m s-1 for (a), (b), (e), (f), (i), and (j);  1 m s-1 for (c), (d), (g), (h), (k), (l), (m) and (n).

The extended intercomparison to CFSR and MERRA can be found at http://icr4.org/posters/Paek_AT-43.pdf.

Add new comment

CAPTCHA
This question is for testing whether or not you are a human visitor and to prevent automated spam submissions.

Atmospheric Reanalyses – Recent Progress and Prospects for the Future

Created by gilbert.p.comp… on - Updated on 08/09/2016 11:46

Atmospheric Reanalyses – Recent Progress and Prospects for the Future.

A Report from a Technical Workshop, April 2010


Michele M. Rienecker, Dick Dee, Jack Woollen, Gilbert P. Compo, Kazutoshi Onogi, Ron Gelaro, Michael G. Bosilovich, Arlindo da Silva, Steven Pawson, Siegfried Schubert, Max Suarez, Dale Barker, Hirotaka Kamahori, Robert Kistler, and Suranjana Saha

Abstract

In April 2010, developers representing each of the major reanalysis centers met at Goddard Space Flight Center to discuss technical issues – system advances and lessons learned – associated with recent and ongoing atmospheric reanalyses and plans for the future. The meeting included overviews of each center’s development efforts, a discussion of the issues in observations, models and data assimilation, and, finally, identification of priorities for future directions and potential areas of collaboration. This report summarizes the deliberations and recommendations from the meeting as well as some advances since the workshop.


Summary of Recommendations

From Rienecker et al. (2012)

Target areas for improvements for the next generation of atmospheric reanalyses include:

• The hydrological cycle

• The quality of the reanalyses in the stratosphere

• The quality of the reanalyses over the polar regions

• Representation of surface fluxes

• Observational bias corrections and/or cross-calibration across platforms

• Estimates of uncertainty in the analyses, and

• Reductions of spurious trends and jumps associated with the changing observing system.


Several recommendations were made regarding areas for coordination between reanalysis centers in order to prepare for the next reanalyses:

• Preparation and sharing of lists of anomalous behavior or features to help identify how common anomalies are across the various reanalyses.

• Examination of data utilization, including QC decisions, innovation statistics, bias corrections, outcomes of data selection algorithms, cloud detection outcomes, etc.

• Identification of joint experiments to be conducted to elucidate issues found to be in common in different reanalyses.

• Sharing of results from jointly designed sensitivity experiments.

• Coordination of input observations and ancillary data and centralization of the serving of these observations where possible.

• Expansion of ACRE’s efforts for contributing surface observations to 20CR to contributing to all future reanalysis efforts, possibly acting as a data coordinator and provider of surface data for all future reanalyses in collaboration with working groups of GCOS and WCRP.

• Development of innovative diagnostics and metrics to help quantify observational issues, the quality and also agreement of the reanalyses.

The workshop recommended that a mechanism be established for the timely exchange of information about the quality of the reanalyses, results of experiments, and plans for future developments. This idea was quickly embraced with the establishment of Reanalysis.org. However, further progress is needed in the utilization of such a capability to enhance communications between reanalysis groups.

Finally, consistent with the Arkin et al. (2003) workshop report, the workshop participants recommended extending the reanalysis record for as long as possible, to include the 1970s for reanalyses focused on the satellite era, and to go back at least to 1850 with those reanalyses using sparse observations.

 
References

Arkin, P., E. Kalnay, J. Laver, S. Schubert, and K. Trenberth, 2003: Ongoing analysis of the climate system: A workshop report. NASA, NOAA, and NSF, 48 pp.  Link to Full Report.

Rienecker, M.M., D. Dee, J. Woollen, G.P. Compo, K. Onogi, R. Gelaro, M.G. Bosilovich, A. da Silva, S. Pawson, S. Schubert, M. Suarez, D. Barker, H. Kamahori, R. Kistler, and S. Saha, 2012: Atmospheric Reanalyses—Recent Progress and Prospects for the Future. A Report from a Technical Workshop, April 2010. NASA Technical Report Series on Global Modeling and Data Assimilation, NASA TM–2012-104606, Vol. 29, 56 pp. Link to Full Report


Dick Dee (not verified)

Tue, 07/30/2013 - 03:50

Hello again.. The 6-hourly temperature and wind analyses from ERA-Interim are 'snapshots' i.e. instantaneous values. You are probably aware however that they are consistent with the relatively coarse time-space resolution of the global model. Winds in particular represent model grid-cell averages and thus do not account for local small-scale variability. Near the surface the winds are consistent with the model's representation of topography which of course is much smoother than the real topography.

Please excuse me if this is posted to the incorrect area and please point me to a different location, if necessary.

I have a question about the ERA-Interim temporal resolution of the temperature and wind reanalyses. What do the 6-hourly values represent? For example, is the 00Z temperature a reanalysis of the instantaneous temperature at 00Z, or is it a 6-hour average? If it is a 6-hour average, is the average from 21Z to 03Z or 06Z-12Z or 00Z-06Z? I think it represents an instantaneous temperature, but I cannot find literature to support this assumption. Also, please comment on the wind parameters. Does the reanalysis represent instantaneous wind components or averages over 6 hours?

I'm sure this is published somewhere, but I have read many documents on the ECMWF website and a few papers, but I have been unable to ascertain the answer. Thanks kindly.

Dear icystorm, From the data FAQ: http://www.ecmwf.int/products/data/archive/data_faq.html 8. What is the difference between analyses, forecasts and accumulated forecasts? ECMWF data can be split into 3 main categories: analyses, instantaneous forecasts and accumulated forecasts. Analyses are produced by combining short-range forecast data with observations to produce the best fit to both. The data are available a few times per day. Instantaneous forecast data are produced by the forecast model, starting from an analysis, and are available at various forecast steps (hours) from the analysis date/time. (Note, forecasts are not initiated from all analyses.) These data are relevant to a particular verifying date/time (analysis date/time plus step). Accumulated forecast parameters are accumulated from the beginning of the forecast. You can divide values by the length of the forecast step to calculate averages over the accumulation period. Some parameters are only analysed (eg. model bathymetry), some are only forecast (e.g. radiative fluxes) and some are both analysed and forecast (e.g. temperature, winds and pressure). If you look at the GRIB records, the internal metadata should also answer your question directly. best wishes, gil compo (University of Colorado/CIRES and NOAA/Earth System Research Laboratory/Physical Sciences Division)

Add new comment

CAPTCHA
This question is for testing whether or not you are a human visitor and to prevent automated spam submissions.

Reports

Created by Chris.Kreutzer on - Updated on 07/13/2017 10:13

Many white papers, published papers, and other reports have been issued relating to reanalyses, their current status, and recommendations for improvements.  Please include such reports below in reverse chronological order, with links to a Discussion reanalyses.org page which summarizes the report and a link to the Full Report itself. 


Fujiwara, M., J. S. Wright, G. L. Manney, L. J. Gray, J. Anstey, T. Birner, S. Davis, E. P. Gerber, V. L. Harvey, M. I. Hegglin, C. R. Homeyer, J. A. Knox, K. Krüger, A. Lambert, C. S. Long, P. Martineau, A. Molod, B. M. Monge-Sanz, M. L. Santee, S. Tegtmeier, S. Chabrillat, D. G. H. Tan, D. R. Jackson, S. Polavarapu, G. P. Compo, R. Dragani, W. Ebisuzaki, Y. Harada, C. Kobayashi, W. McCarty, K. Onogi, S. Pawson, A. Simmons, K. Wargan, J. S. Whitaker, and C.-Z. Zou: Introduction to the SPARC Reanalysis Intercomparison Project (S-RIP) and overview of the reanalysis systemsAtmos. Chem. Phys., 17, 1417-1452, doi:10.5194/acp-17-1417-2017, 2017. Link to Paper. 

Compo, G., J. Carton, X. Dong, A. Kumar, S. Saha, J. S. Woollen, L. Yu, and H. M. Archambault, 2016: Report from the NOAA Climate Reanalysis Task Force Technical Workshop. NOAA Technical Report OAR CPO-4, Silver Spring, MD. doi: 10.7289/V53J39ZZ. Full Report.

Bosilovich, M.G, J.-N.Thépaut, O. Kazutoshi, A. Kumar, D. Dee and Otis Brown, 2015: WCRP Task Team for Intercomparison of ReAnalyses (TIRA). White Paper. Full Report.

CORE CLIMAX, 2014: Procedure for comparing reanalyses, and comparing reanalyses to assimilated observations and CDRs. COordinating Earth observation data validation for RE-analysis for CLIMAte ServiceS, Grant agreement No: 313085, Deliverable D5.53, pp 45. Full report

Bosilovich, M. G., J. Kennedy, D. Dee, R. Allan and A. O’Neill, 2013: On the Reprocessing and Reanalysis of Observations for Climate, Climate Science for Serving Society: Research, Modelling and Prediction Priorities. G. R. Asrar and J. W. Hurrell, Eds. Springer, in press. Full Report. Discussion Page

Bosilovich, M.G., M. Rixen, P. van Oevelen, G. Asrar, G. Compo, K. Onogi, A. Simmons, K. Trenberth, D. Behringer, T. H. Bhuiyan, S. Capps, A. Chaudhuri, J. Chen, L. Chen, N. Colasacco-Thumm, M. G. Escobar, C.R. Ferguson, T. Ishibashi, M.L.R. Liberato, J. Meng, A. Molod, P. Poli, J. Roundy, K. Willett, J. Woollen,R. Yang, 2012: Report of the 4th World Climate Research Programme International Conference on Reanalyses, Silver Spring, Maryland, USA, 7-11 May 2012. WCRP Report 12/2012. Full Report. Discussion Page.

Rienecker, M.M., D. Dee, J. Woollen, G.P. Compo, K. Onogi, R. Gelaro, M.G. Bosilovich, A. da Silva, S. Pawson, S. Schubert, M. Suarez, D. Barker, H. Kamahori, R. Kistler, and S. Saha, 2012: Atmospheric Reanalyses—Recent Progress and Prospects for the Future. A Report from a Technical Workshop, April 2010. NASA Technical Report Series on Global Modeling and Data Assimilation, NASA TM–2012-104606, Vol. 29, 56 pp. Full Report. Discussion Page.

Climate Change Science Program, 2008: Weather and Climate Extremes in a Changing Climate. Regions of Focus: North America, Hawaii, Caribbean, and U.S. Pacific Islands. A Report by the U.S. Climate Change Science Program and the Subcommittee on Global Change Research. [Thomas R. Karl, Gerald A. Meehl, Christopher D. Miller, Susan J. Hassol, Anne M. Waple, and William L. Murray (eds.)]. Department of Commerce, NOAA's National Climatic Data Center, Washington, D.C., USA, 164 pp. Full Report.

Climate Change Science Program, 2008: Reanalysis of Historical Climate Data for Key Atmospheric Features: Implications for Attribution of Causes of Observed Change. A Report by the U.S. Climate Change Science Program and the Subcommittee on Global Change Research [Randall Dole, Martin Hoerling, and Siegfried Schubert (eds.)]. National Oceanic and Atmospheric Administration, National Climatic Data Center, Asheville, NC, 156 pp. Full Report.

Lermusiaux, P.F.J.,  P. Malanotte-Rizzoli, D. Stammer, J. Carton, J. Cummings, and A.M. Moore, 2006: Progress and Prospects in U.S. Data Assimilation in Ocean Research. Oceanography, 19, 172-183. Full Report.

Arkin, P., E. Kalnay, J. Laver, S. Schubert, and K. Trenberth, 2003: Ongoing analysis of the climate system: A workshop report. NASA, NOAA, and NSF, 48 pp.  Full Report.


Zeng-Zhen.HU

Thu, 08/02/2012 - 12:54

Two recent publications:

Kumar, A. and Z.-Z. Hu, 2012: Uncertainty in the ocean-atmosphere feedbacks associated with ENSO in the reanalysis products. Clim. Dyn., 39 (3-4), 575-588. DOI: 10.1007/s00382-011-1104-3.

Xue, Y., B. Huang, Z.-Z. Hu, A. Kumar, C. Wen, D. Behringer, and S. Nadiga, 2011: An assessment of oceanic variability in the NCEP Climate Forecast System Reanalysis. Clim. Dyn., 37 (11-12), 2511-2539, DOI: 10.1007/s00382-010-0954-4.

Add new comment

CAPTCHA
This question is for testing whether or not you are a human visitor and to prevent automated spam submissions.

RAOBCORE/RICH Visualization

Created by lorenzo.ramell… on - Updated on 03/29/2021 09:27

RAOBCORE and RICH

online Viewers now available!


RAOBCORE => RAdiosone OBservation COrrection using REanalyses

RICH              => Radiosonde Innovation Composite Homogenization


New visualization utility for RAOBCORE and RICH adjusted global radiosonde dataset now available:

RAOBCORE/RICH

Version 1.5.1

RAOBCORE corrections 

http://srvx7.img.univie.ac.at/~leo/richvis/newindex.html 

New visualization utility for RAOBCORE 2.0 global radiosonde dataset now available.

Adjustments are not yet provided.

RAOBCORE v2.0 Viewer 

http://srvx7.img.univie.ac.at/~lorenzo/DEVL_rrvis_2.0/html/

Notes: Viewer RAOBCORE 2.0

  • Station : WMO radiosonde station number (not all the stations ara available for all the archives)
  • Varibale;
  • Pressure level [hPa];
  • Type: observation, biascorrection (if available), FirstGuess departures (if available) and Analysis departures ( if available); 
  • Smooth: running mean over the time serie;
  • Experiment: only Control is available;
  • Data from: in this menu are shown all the possible soure of data we are using:
    • Stations_ERA_INTERIM: data from ERA_INTERIM (observations and departures);
    • Stations_ERA_40: data from ERA_40 (obseravtiona and departures);
    • Stations_CHUAN_montly: monthly data from the CHUAN archive (observations from CHUAN);
    • Stations_CHUAN_daily: daily data from the CHUAN archive (observation from CHUAN, Analysis departures from 20CR);
    • 20CR: recoverd (only in presence of observation) time series from the 20CR interpolated at the station latitude and longitude;
    • ERA_40: recoverd (only in presence of observation) time series from ERA_40 interpolated at the station latitude and longitude;
    • long_20CR: recoverd time series (covers all the 20CR length) from the 20CR interpolated at the station latitude and longitude;
    • MERGED_archive: it contains merged obseravtions data from ERA_INTERIM, ERA_40 and CHUAN; the analysis departures are from 20CR.
  • Adjustment_Method: only Unadjusted is now available;
  • Version: only v2.0 is available;
  • Long_Time: 
    • 00h: data at Midnight;
    • 12h: data at Noon;
    • 00h - 12h: difference between Midnight  and Noon;
  • PlotSetting:
    • Jump_Missing: if there is a missind value, nothing is plotted;
    • Linear_Connection: if there is a missing value, a linear connection between the last available and the new available will be plotted;
  • Metadata: shows (if available) the metadata for the selected station; 
  • Overplot: allows plotting many time series on the same frame;
  • Tooltip: gives hints about the different menus;
  • Autorefresh: at each selection it tries to plot the current setting;
  • Range: scaled for the time axis;
  • Delete Last: deletes the last plot form the frame;
  • Delete All : deletes all the plots from the frame;

In order to zoom in: select with a mouse and drag the area that you would like to inspect. It will be magnified in the main frame. 


Suggested stations for a easy start :

  • Temperature:

Station: 010393, Merged archive, pressure 1000 or 850 hPa -> long time series back to 1905

Station: 004018, Merged archive, pressure 850 hPa -> continue time serie back to 1946;


  • U and V Wind component:

Station: 016716, Merged archive, pressure 200 hPa, Type: Observations and Analysis depertures -> big shift (better visible with smooth bigger than 100);

  •  Wind Speed:

Station: 016716, Merged archive, pressure 200 hPa, Type: Observations and Analysis depertures -> big shift (better visible with smooth bigger than 100)  


Add new comment

CAPTCHA
This question is for testing whether or not you are a human visitor and to prevent automated spam submissions.