Observations

ocean reanalyses table

Created by Cathy.Smith@noaa.gov on - Updated on 03/02/2022 14:27

Comparison Table of Ocean Reanalyses: Global

Dataset Yyears resolution levels model
NCEP/GODAS 1980-present Horizontal 1°x1° (1/3° meridional at the tropics)    MOMv3
NASA ECCO 1993-2017? 1x1 10 in top 10 50 MITgcm and MOM4
BLUELINK 1992-2008 ? 47 MOM4 + Chen hybrid mixed layer
CMCC C-GLORS 1980-2015 Horizontal 1/4°x1/4° (ORCA025 tripolar grid) 50 NEMO V3.2 + LIM2
CMCC CHOR (Historical Reanalysis) 1900-2010 Horizontal 1/2°x1/2° (ORCA05 tripolar grid)  75 NEMO V3.4 + LIM2
NCEP CFSR 1979-near present

Horizontal .25 near the equator;

0.5 beyond the tropics

40 GODAS w/MOM4
ECMWF ORAS5 1979-near present

Horizontal 1/4°x1/4°

about 1m level thickness in upper 200 m.

75 NEMO V3.4.1
ECMWF ORAS4 1958-?

Horizontal 1°x1° with equatorial refinement (0.3)

about 10m level thickness in upper 200 m.

42 NEMO V3.0
GECCO 1952-2001 Horizontal 1°x1° 23 MITgcm
GECCO2 1948-2014 1x1/3° 50 MITgcm
GFDL 1961-2012 Global Tripolar grid (360 by 200), 50 ECDA
GLORYS2V4 1993-2016 Global, 1/4° Mercator grid.1m top level, 200m bottom level

75


Mercator Océan / Copernicus Marine Environment Service (CMEMS)
GMAO 1980-present

1/2° Ocean, 1° Atmosphere

?

GEOS AGCM, MOM4p, CICE
INCOIS-GODAS 2004-almost real time 0.5 deg in the zonal direction. In the meridional direction it is 0.25 between 10S-10N and 0.5 poleward 30 40 MOM4.0
SODA ?? Horizontal 0.25°x0.25at the equator reducing to <10km in the Arctic 50 MOM5
TOPAZ 1992-2016 Horizontal 12km in the Arctic to <16 km in North Atlantic 28 HYCOM v2.2, CICE v3
U of Reading UR025.3 ?? 1/4o 46 NEMO coupled ice-ocean model v2.3
U of Reading UR025.4 1989-2010 1/4 75 NEMO coupled ice-ocean model v3.2
BRAN2020 1993-2020      

Add new comment

CAPTCHA
This question is for testing whether or not you are a human visitor and to prevent automated spam submissions.

Pressure biases in early ship observations

Created by mapr8844 on - Updated on 09/20/2016 17:03

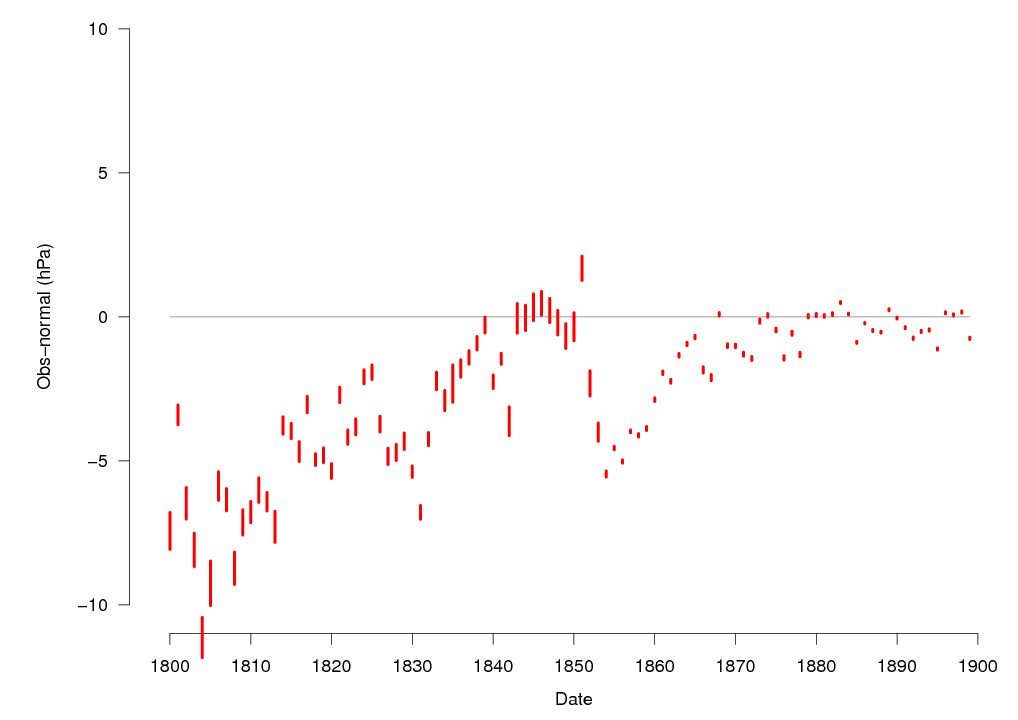
Pressure observations from ships are known to be biased low by about 5hPa in the 1850s - I've been looking into this. I've made an hourly MSLP climatology from 20CR2c over 1981-2010, and for every C19 observation in ICOADS3b4 with good data (has all of date, location, SLP & AT) I've calculated the observed anomaly to this climatology. Averaging those by year gives the graph below.

Annual average mean SLP bias in ICOADS3 beta 4 observations (mean +- 2 standard errors)

Annual average mean SLP bias in ICOADS3 beta 4 observations (mean +- 2 standard errors)

ICOADS is divided into decks (different observation sources). Calculating the mean bias for each deck with pre-1870 observations shows the dominant contributions are from Decks 248 (English East India ships), 701 (US Maury), and 721 (German Maury), and the time variation split by deck persuaded me to concentrate on deck 721 in the first instance, as that's important (lots of obs., relatively late in the period) and has a relatively homogeneous bias.

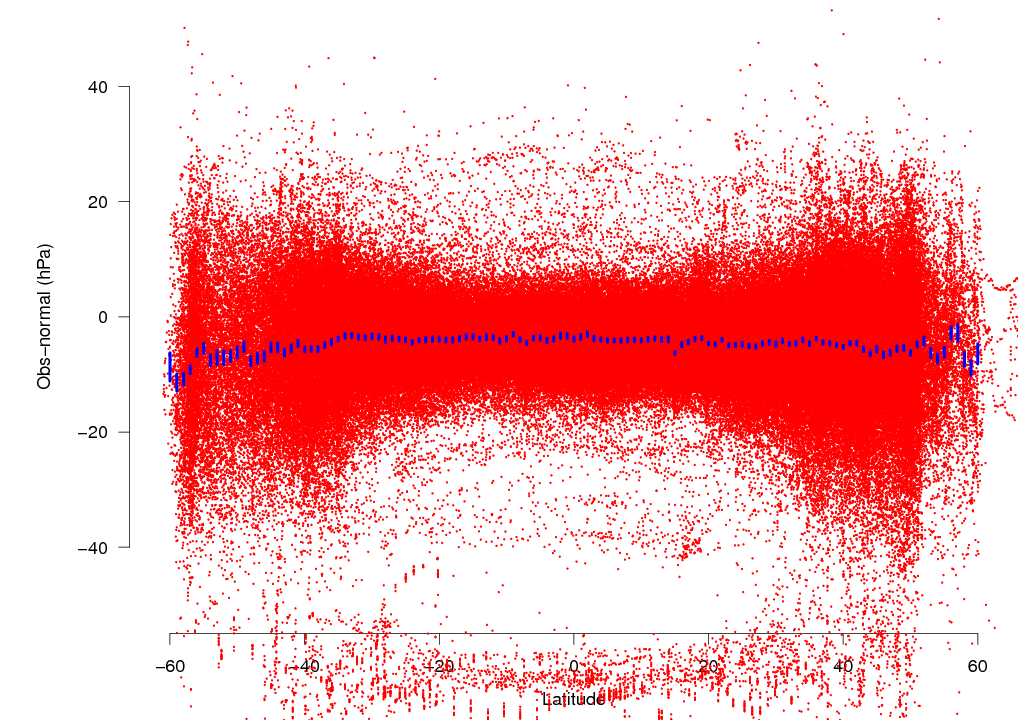
If the bias depends on the environment - if it's a mis-applied temperature or gravity correction, or caused by movement of the barometer for example - I'd expect it to vary in some systematic fashion with the latitude of the observation: it doesn't.


SLP bias in pre-1870 deck 721

SLP bias in pre-1870 deck 721 observations as a function of observation latitude (red dots). Mean +- 2 standard errors of the bias in each 1 degree latitude band (blue lines).

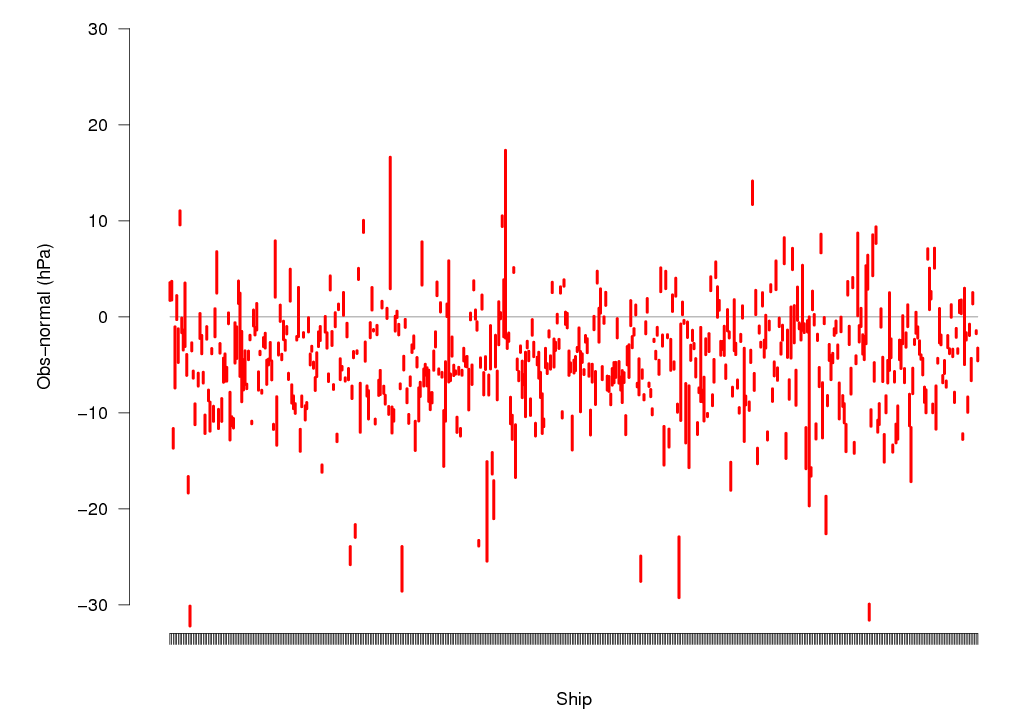
The mean bias does not co-vary systematically with latitude, or with any parameter that itself co-varies with latitude (so not temperature, pressure, storminess, gravity, ...). It does, however, vary substantially between ships:


SLP bias in pre-1870

SLP bias in pre-1870 deck 721 observations for each distinct ship (observation ID). (Mean +- 2 standard errors).

Deck 248 shows the same results.

interpret this to mean that this is an instrument error - early barometers had substantial systematic biases (constant offsets) and those offsets were themselves systematically biased - they were more likely to be negative than positive. These offsets got smaller with time as the instruments improved, becoming small by 1870. [Any ideas for how we might test this interpretation?].

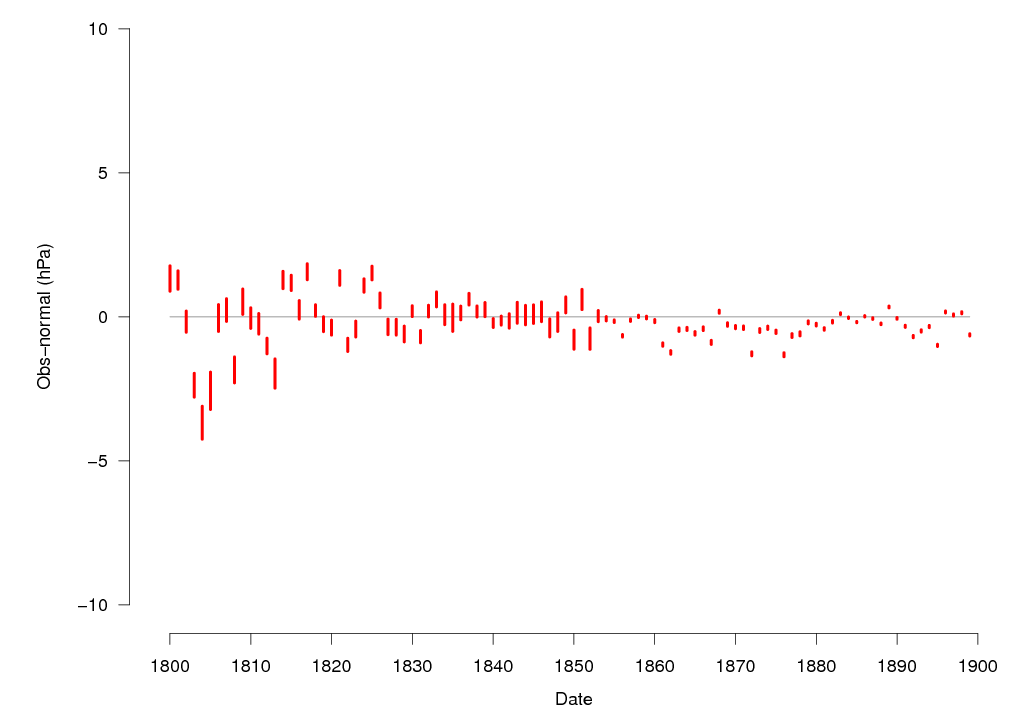
That means we could bias-correct the early observations by calculating a mean offset for each identifiable ship and applying it to all their observations (and put these in IVAD). This is straightforward to do and gets rid of the time-varying biases very nicely:

repeat of top figure

Repeat of top figure, except with a constant bias offset applied to each identifiable ship.

Most ships have a short lifetime, so a ship-specific correction would homogenize the time series even if the cause were not a ship-specific bias. So this figure does not prove that the diagnosis is correct, but it does show that the proposed solution would have the desired effect.

[Response (from Philip) to comment below from Anonymous (a.k.a. Clive Wilkinson)]

I'm pretty sure there are very few aneroid barometers in the pre-1870 obs. Wallbrink et al. 2009 claims there are few in the US Maury (though I'm n ot sure how they know). In the German Maury in some cases the SLP was not corrected for temperature, presumably because those observations did not include a barometer temperature, which could indicate they are aneroid observations. But if we compare the two groups it's clear they should all have been corrected:

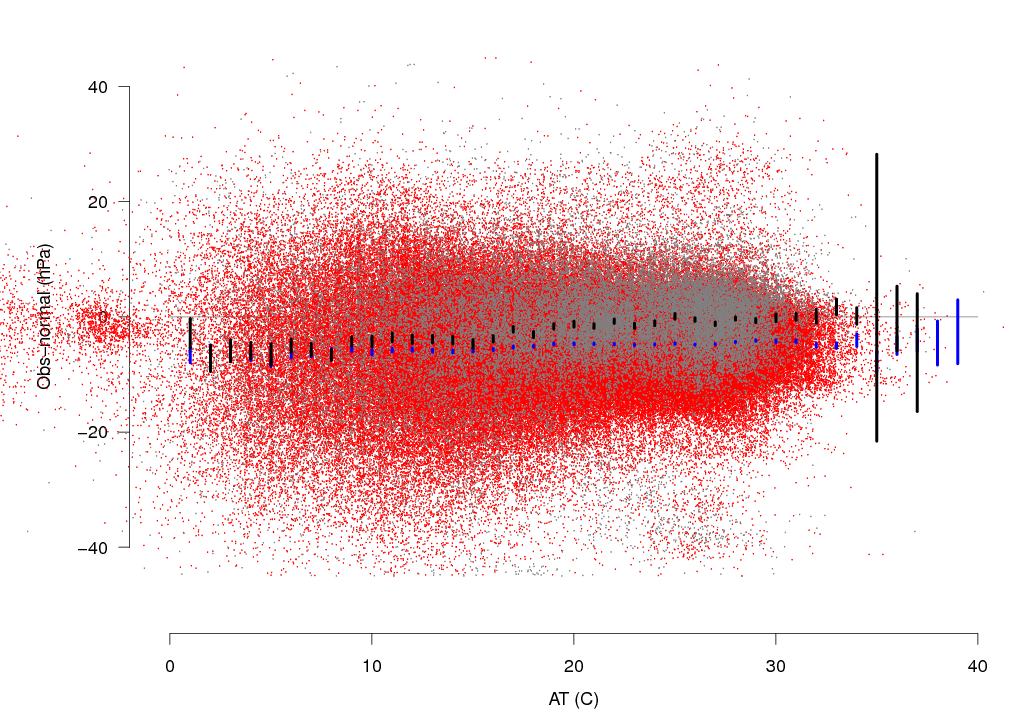
slp bias pre 1870'

SLP bias in pre-1870 deck 721 observations as a function of observed air temperature, in two groups: Red dots are observations with observed barometer temperatures and temperature corrections made (PB==1 in ICOADS), blue bars are mean+-2se in each 1C AT band; Grey dots are observations without barometer temperatures so no temperature corrections (PB==2), black bars are mean+-2se in each 1C AT band.

If we temperature corrected the grey dots using observed AT for barometer temperature, the temperature dependent bias would disappear, and we'd get the same constant bias as in the corrected obs. So the uncorrected obs need correction, which means they are from mercury barometers, and there is no substantial group of aneroid obs in this deck. This is another bias we could correct, though the effect is modest as the number of non-temperature corrected pressure obs is not that large.

[below: added by Laura Slivinski]

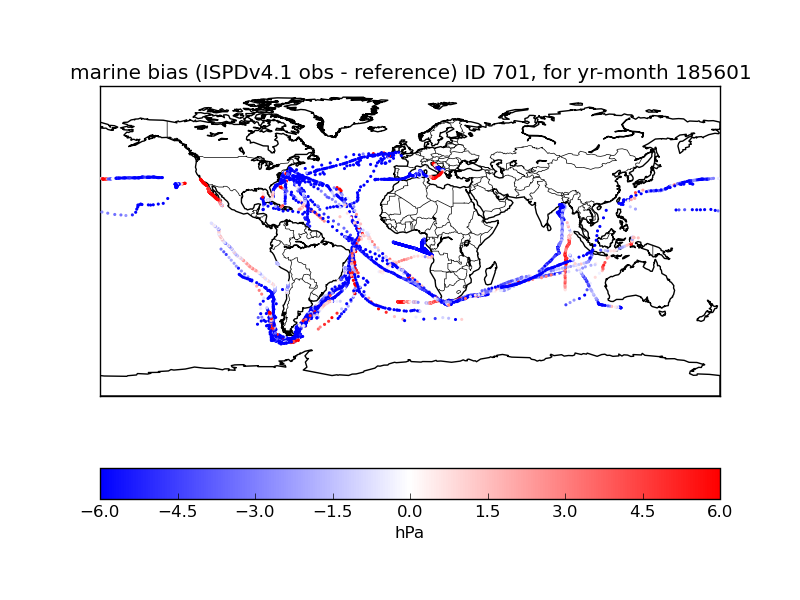
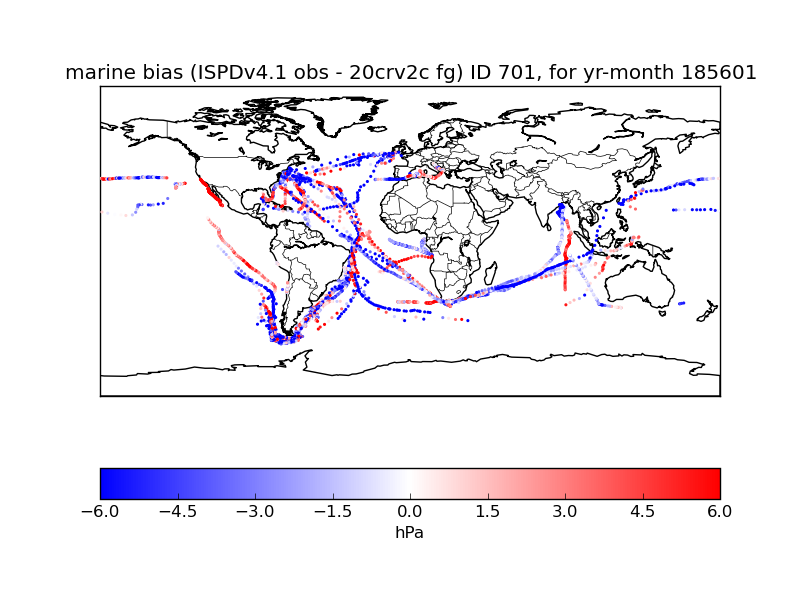
We have also been doing some investigations of this ship bias, as it relates to the 20CRv2c dataset.  Below are two maps of the US Maury (deck 701) ship tracks for Jan 1856, colored by bias.  In the first figure, the bias is calculated as "obs minus reference," where we have used a climatology of 20CRv2c analysis averaged over 1951-1999.  The second figure is the same dataset, but the bias is calculated as "obs minus first guess," ie, the model forecast from the previous analysis step, but before the observation has been assimilated.  Generally the behavior is fairly similar, though the "obs minus reference" case definitely seems to make the observation bias look lower.

These figures further suggest that correcting bias on a ship-by-ship basis, or even preprocessing a single ship track, would be a reasonable step, as the ship tracks generally (though not always) have consistent biases.  They also hint at the issues with comparing to a climatology, though.  (As mentioned in a comment, the climatology may be different between the 1850s and the late 20th century.)  However, the "first guess" state is forecasting from analysis states which have already assimilated the biased ship observations, so that might not be ideal on its own either.

US maury

US Maury ship tracks for Jan 1856, colored by (observation minus reference), where reference = 20CRv2c climatology from 1951-1999.


us maury ship tracks

US Maury ship tracks for Jan 1856, colored by (observation minus first guess) where "first guess" is the pre-update forecast from 20CRv2c for that time.


Note: this page was replaced post website update, below are comments that were previously available.

  • Re: Pressure biases in early ship observations

    Submitted by Yvan Duil (not verified) on Fri, 05/20/2016 - 13:23. 

    The only elegant way to get around this would be to used an iterative process. Detecting the bias by comparison to a first get, then removed the bias from the input data and do a second assimilation. Re-iterate a much as needed. Since assimilation is cheap when there is few data points that might be affordable before 1870.

  • Re: Pressure biases in early ship observations

    Submitted by Yvan Duil (not verified) on Fri, 05/20/2016 - 09:58. 

    This is a fundamental problem : bias in data bias the model. ERA-20C had an issue with Tristan da Cunha data that messed the model and the data assimilation process locally. There is no nice way to get around that in data sparse region except by assuming climatology. I am wondering is it would be possible to run the model with the time direction inverted. This way you would start from a data rich environment to a data poor one. This should make easier to spot bias.

  • Re: Pressure biases in early ship observations

    Submitted by Anonymous (not verified) on Thu, 05/19/2016 - 06:42. 

    If the bias is ship specific, and up to c. 1870s, could we be looking at a change from mercurial marine barometers and the introducton of aneroid barometers. Do we have any metadata on the instuments used. Another possibility - what about how the observation is recorded when the barometer is pumping. Was an instruction issued to make obs consistent if before this various ways of observing a pumping barometer had been used.

    • Re: Pressure biases in early ship observations

      Submitted by philip on Thu, 05/19/2016 - 09:45. 

      If pumping were important, I'd expect to see a bigger effect in the mid-latitudes, where the weather is worse and more changeable, than in the tropics. We don't see such an effect - the absence of any substantial variation with Latitude is a strong indication that no interesting physical effect is playing a role, any such effect would be different in the tropics and the mid-latitudes. It also suggests that it's not a change in observing method, as a change in method to minimise the effect of pumping (for example) would effectively increase or decrease the pumping effect, and would vary with latitude. If it's an observing method change it's one that has the same effect in all weather conditions.

      I like the idea of a mercury-> aneroid transition, as I think it's plausible that dodgy mercury barometers tend to be biased low, while dodgy aneroid barometers are equally likely to be biased low or high (I've no idea if they are, but it sounds possible). I'll see if there's any metadata on barometer type in the Maury decks.

      • Re: Pressure biases in early ship observations

        Submitted by philip on Fri, 05/20/2016 - 10:52. 

        It turns out not to be a mercury->aneroid transition (see above) - these observations are all from mercury barometers.

    • Re: Pressure biases in early ship observations

      Submitted by Yvan Duil (not verified) on Thu, 05/19/2016 - 06:21. 

      Your procedure looks sound. However, I have an issue with the climatology used. We do expect that some change has occurred over time in pressure field due to climate change . Using a recent climatology might bias the old climatology to look more like the modern one than it used to.

    • Re: Pressure biases in early ship observations

      Submitted by philip on Thu, 05/19/2016 - 09:47. 

      It would be better to use a C19 climatology, but any such climatology would be contaminated by the obs. being examined, and I was keen to avoid that complication.

    • Re: Pressure biases in early ship observations

      Submitted by Yvan Duil (not verified) on Thu, 05/19/2016 - 10:01. 

      No win here obviously. Actually debiasing should be done on every ship data backward of 1980.

Add new comment

CAPTCHA
This question is for testing whether or not you are a human visitor and to prevent automated spam submissions.

Proposal for assembling the ISPD V4.3

Created by Chesley.McColl on - Updated on 08/15/2016 13:05

Here is my current understanding of our process for assembling the new ISPD V4.3, using ICOADS 3.0, ISPD 4.0 and IBTrACS v03r08.

ICOADS 3.0 has applied a land mask that we want to ignore for the ship decks from the ACRE collection.

- inorder to use all the data from the ACRE I will need to remove the observations for those ship decks from the ICOADS3.0 (from 1870 - 1946) and blend ACRE data in.

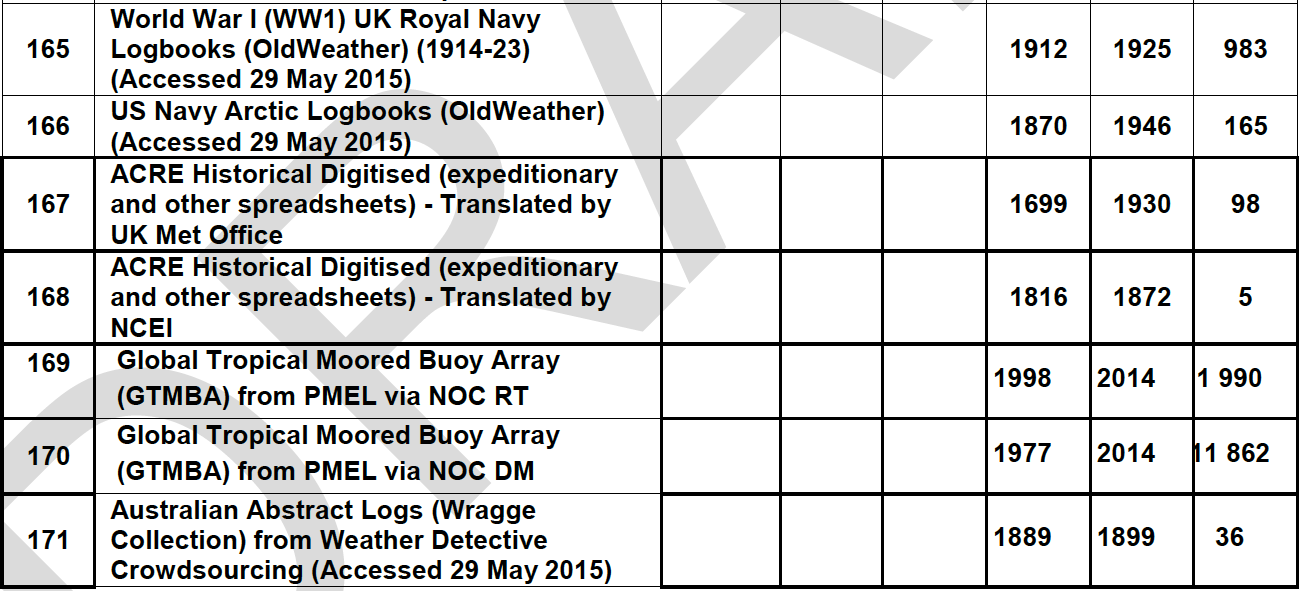
This will include the old weather from the Oldweather US log books and the crowdsourced Weather Detective (DECK 710 and 711)

From Gil: there should also be another Oldweather related deck of UK royal navy.

From Chesley: I think you are referring to the Source ID ?

Here is the link to documentation for the ICOADS 3.0  Talking with Sandy Lubker she thinks the data used in ICOADS3 was downloaded from 

This may be where they are:


https://github.com/oldweather/oldWeather1/tree/ICOADS_R3.0/imma


https://github.com/oldweather/Weather-Detective/releases/tag/ICOADS3.p1


https://github.com/oldweather/oldWeather3/releases/tag/ICOADS3.p1


https://github.com/oldweather/Expeditions/releases/tag/ICOADS3.p1


Sandy

These are the particular snippets for the DECK ID's resently added old weather oberservations

Newly added ICOADS SourceID's

Once the data is removed from the ICOADS the UniqueID they have will be lost... ** note that ICOADS has all entries that were not "trimmed" for land mask, even those that do not have a pressure observation

From Gil:The IMMA files provided by Philip Brohan would need to retain the ICOADS UniqueID

From Chesley: I see two problems with trying to maintain the UID from ICOADS

      1)  The record itself will have been altered for the SLP, so if the user were to look at ICOADS3 for that UID they would not see the same obervation

      2)  There will be additional oberservations that have no ICOADS UID for obs that were "trimmed" 

We want to add a bias correction to all ICOADS observations, including the ACRE observations, (from 1780-1871)

One idea is to pull all the IMMA records from ICOADS3 that are from the specified Decks, merge with all the ACRE IMMA files, remove the duplicates that contain no UID,  then edit the SLP values and merge back with the full marine collection.

           or if we don't need the UID remove the data that are from the specified Decks, edit all the ACRE IMMA files with "corrected" SLP values and merge back. ***

           or we could create a table of ShipName/YYYYMM/bias, and I would write a wrapper to check this file, if bias correction exists apply to the observation.

*** probably the easiest, most reliable way

The German Maury is included in the ICOADS3.0, some of the measurements have both temp and gravity corrections and some not, so not sure if you want to "remove" the Maury also, and add back the observations with the corrections you wanted applied.

From Gil: We would want to remove German Maury (Deck 721 SID 152) and replace with consistently corrected for gravity and temp.

gilbert.p.comp…

Mon, 08/15/2016 - 12:27

Chesley,

Would you clarify what you mean by

"The record itself will have been altered for the SLP, so if the user were to look at ICOADS3 for that UID they would not see the same obervation"

I thought that SLP is in the ICOADS3 record.  In the ISPD, we keep the original value as obtained from the source, as well as any corrected or adjusted value.


thanks for clarifying,

gil


philip@brohan.org

Mon, 07/04/2016 - 03:51

It's not just the land mask - the ICOADS QC process is missing background fields for some areas (notably the polar latitudes) for older obs, but the upshot is that many of the early obs are rejected by the QC process for bad reasons. So for our early obs, because we have many useful obs in ports and at high latitude, we would do better to use all the obs, rather than just the obs retained by the ICOADS QC.

I think the simplest way to do this is to get both the released ICOADS3.0, and the 'all-observations file' for ICOADS3.0 (could limit to pre-1950 to save space), and just to swap sources - delete all of SID 165 (oW WW1 ships) in the released file and replace with SID165 in the all file. I'd do this for SIDs 165, 166, 167, 168, 148 128 and 247.

Both released and All files are at NCAR, though an NCAR account is necessary to get the all files (ask Sandy, or Steve Worley)

Add new comment

CAPTCHA
This question is for testing whether or not you are a human visitor and to prevent automated spam submissions.

Environment Canada digizited stations before 1930

Created by gilbert.p.comp… on - Updated on 07/18/2016 10:13

Stations digitized by Environment Canada having pressure observations for the years 1929 and earlier.


Inventory of station and sea level pressure observations having observations before 1930 digitized by

Environment Canada, Climate Research Division, Data Theme

provided courtesy of Xiaolan Wang, Climate Research Division, Environment Canada

A formatted text file version of this list: DigitizedPressurePre1930_station_info.txt

The total period of record is given.

STN_ID      NAME            PERIOD    LAT (d   m)    LON (d   m)      MISSING_YEAR              

1018620   Victoria         1899-1952       48 24        -123  19

1108447   Vancouver        1911-1952       49 17        -123  05

1163780   Kamloops         1897-1952       50 42        -120  27          1908    

2100400   Dawson           1906-1952       64 04        -139  20

2200100   Aklavik          1926-1952       68 13        -135  00          1941-1943         

2201500   Fort Good Hope 2 1920-1952       66 15        -128  38

2201600   Fort Mcpherson   1920-1936       67 26        -134  57          1924,1928,1933,1934

2201700   Fort Norman      1920-1951       64 55        -125  41          1929

2202100   Fort Simpson     1920-1952       61 52        -121  21          1946

2202200   Fort Smith       1920-1952       60 00        -111  58          1944

2400600   Cambridge Bay    1927-1952       69 06        -105  08          1928,1933

2402681   Lake Harbour     1922-1933       62 53         -69  55          1926-1929

2402900  Nottingham Island 1927-1952       63 07         -77  56

2403050   Pangnirtung      1925-1950       66 09         -65  30          1927-1929,1947-1948

2403200   Pond Inlet       1921-1952       72 41         -78  30          1929,1947-1948,1951

2403600  Resolution Island 1929-1952       61 18         -64  53

3012208   Edmonton         1906-1952       53 33        -113  30          1908

3031093   Calgary          1920-1952       51 04        -114  02

3034480   Medicine Hay     1920-1952       50 01        -110  43

3050520   Banff            1920-1952       51 11        -115  34

3062693   Ft Mcmurray      1909-1952       56 55        -111  35          1914-1920

3072657   Fort Chipewyan   1898-1940       58 43        -111  09          1905-1906,1913-1919

4028040   Swift Current    1907-1952       50 20        -107  45          1908

5023222   Winnipeg         1896-1952       49 53         -97  07          1897-1905

5052880   The Pas          1912-1952       53 58        -101  06

5060600   Churchill        1926-1952       58 44         -94  04          1929-1931

6048261   Thunder Bay      1877-1952       48 22         -89  20          

         (Port Arthur)

6071712   Cochrane         1920-1939       49 04         -81  02

6075425   Moosonee         1921-1952       51 16         -80  56

6104146   Kingston         1872-1890       44 13         -76  36

6143067   Guelph           1920-1950       43 32         -80  19

6158733   Toronto          1840-1952       43 40         -79  24          1843,1845,1850-1870  

7016294   Quebec           1853-1952       46 48         -71  23          1856-1857,1859,1862-1865,1871,1941-1946

7025250   Montreal         1831-1952       45 28         -73  45          1836-1837   

7050200 Anticosti SW Point 1881-1952       49 24         -63  33

7056067  Father Point      1874-1951       48 30         -68  29

(7052360)

7092130  Doucet            1922-1939       48 13         -76  37

7111080 Cape Hopes Advance 1928-1952       61 05         -69  33          1940,1941,1947           

7113534  Kuujjuaq          1922-1952       58 06         -68  25          1930,1935-1946,1948

        (Fort Chimo)

8101000  Chatham           1874-1952       47 01         -65  28

8104900  Saint John        1875,1896,1907-1952   45 19   -65  53          1876-1895,1897-1906

8202200  Halifax           1828-1952       44 39         -63  34          1867,1901-1905

8204700  Sable Island      1902-1952       43 56         -60  01          1905-1907

8205700  Sydney            1874-1952       46 10         -60  03          1901-1905,1908  

8206440  Wolfville         1927-1949       45 06         -64  22

8206500  Yarmouth          1870-1952       43 50         -66  02

8300300  Charlottetown     1873-1952       46 17         -63  08

8401600  Fogo              1920-1950       49 43         -54  17          1933

8403506  St John's         1852-1952       47 37         -52  45          1863-1865,1871-1872,1943-1948

8500500  Belle Isle        1920-1952       51 53         -55  23          1930-1932


Add new comment

CAPTCHA
This question is for testing whether or not you are a human visitor and to prevent automated spam submissions.

Near Canada Stations in ISPD version 4 before 1930

Created by gilbert.p.comp… on - Updated on 07/18/2016 10:13

Stations in Canada and its vicinity expected in the International Surface Pressure Databank version 4 for the years 1929 and earlier

Xungang Yin of NOAA's National Climatic Data Center has generated the following list of stations being merged in ISPD version 4.

Not all of the following stations are necessarily in Canada to have made this list. Please feel free to comment on stations that should 

removed. 

A formatted text file version of this list: Canada_stations_before1929.txt

#  StationID                 Station_Name                     Lat    Lon      period of record  [internal dir]

01 2200100        "AKLAVIK A                     "  68.22  224.99:  1926-1929   [ISPD_dir=ISPD2_2_4/canada/2200100.asc]

02 2201500        "FORT GOOD HOPE 2              "  66.25  231.37:  1920-1929   [ISPD_dir=ISPD2_2_4/canada/2201500.asc]

03 2202100        "FORT SIMPSON                  "  61.87  238.65:  1920-1929   [ISPD_dir=ISPD2_2_4/canada/2202100.asc]

04 2202200        "FORT SMITH                    "  60.02  248.04:  1920-1929   [ISPD_dir=ISPD2_2_4/canada/2202200.asc]

05 2400600        "CAMBRIDGE BAY A               "  69.11  254.86:  1927,1929   [ISPD_dir=ISPD2_2_4/canada/2400600.asc]

06 2402681        "LAKE HARBOUR                  "  62.83  290.08:  1922-1925   [ISPD_dir=ISPD2_2_4/canada/2402681.asc]

07 2402900        "NOTTINGHAM ISLAND             "  63.12  282.07:  1927-1929   [ISPD_dir=ISPD2_2_4/canada/2402900.asc]

08 2403050        "PANGINIRTUNG                  "  66.13  294.27:  1925-1926   [ISPD_dir=ISPD2_2_4/canada/2403050.asc]

09 2403200        "POND INLET                    "  72.68  282.02:  1921-1928   [ISPD_dir=ISPD2_2_4/canada/2403200.asc]

10 2403600        "RESOLUTION ISLAND             "  61.30  295.12:  1929   [ISPD_dir=ISPD2_2_4/canada/2403600.asc]

11 3062693        "FORT MCMURRAY                 "  56.65  248.78:  1909-1913,1921-1929   [ISPD_dir=ISPD2_2_4/canada/3062693.asc]

12 3072657        "FORT CHIPEWYAN                "  58.72  248.85:  1898-1904,1907-1912,1920-1929   [ISPD_dir=ISPD2_2_4/canada/3072657.asc]

13 5060600        "CHURCHILL                     "  58.74  265.94:  1926-1928   [ISPD_dir=ISPD2_2_4/canada/5060600.asc]

14 7113534        "KUUJJUAQ A                    "  58.10  291.58:  1922-1929   [ISPD_dir=ISPD2_2_4/canada/7113534.asc]

15 8500500        "BELLE ISLE                    "  51.88  304.62:  1920-1929   [ISPD_dir=ISPD2_2_4/canada/8500500.asc]

16 7050200        "ANTICOSTI                     "  49.40  296.42:  1911-1929   [ISPD_dir=ISPD2_2_4/ispd1_1/canadian/anticosti]

17 8300300        "CHARLOTTETOWN                 "  46.28  296.87:  1873-1929   [ISPD_dir=ISPD2_2_4/ispd1_1/canadian/charlot]

18 8101000        "CHATHAM                       "  47.02  294.53:  1907,1909-1929   [ISPD_dir=ISPD2_2_4/ispd1_1/canadian/chatha]

19 2100400        "DAWSON                        "  64.07  220.67:  1906-1929   [ISPD_dir=ISPD2_2_4/ispd1_1/canadian/dawson]

20 3012208        "EDMONTON                      "  53.57  246.48:  1906-1929   [ISPD_dir=ISPD2_2_4/ispd1_1/canadian/edmonton]

21 7052360        "FATHER_POINT                  "  48.52  291.68:  1874-1876,1906-1929   [ISPD_dir=ISPD2_2_4/ispd1_1/canadian/father]

22 8202200        "HALIFAX                       "  44.65  296.43:  1861-1866,1868-1875,1896,1906-1929   [ISPD_dir=ISPD2_2_4/ispd1_1/canadian/halifax]

23 1163780        "KAMLOOPS                      "  50.70  239.55:  1907-1929   [ISPD_dir=ISPD2_2_4/ispd1_1/canadian/kamloo]

24 5052864        "LE_PAS                        "  53.82  258.75:  1916-1929   [ISPD_dir=ISPD2_2_4/ispd1_1/canadian/le_pas]

25 7025250        "MONTREAL                      "  45.47  286.25:  1859-1860,1872,1874-1875,1880-1889,1891-1929   [ISPD_dir=ISPD2_2_4/ispd1_1/canadian/montreal]

26 6046E88        "PORT_ARTHUR                   "  48.45  270.80:  1906-1929   [ISPD_dir=ISPD2_2_4/ispd1_1/canadian/port_a]

27 7016294        "QUEBEC                        "  46.80  288.62:  1853-1855,1858,1860-1861,1866-1870,1873-1929   [ISPD_dir=ISPD2_2_4/ispd1_1/canadian/quebec]

28 8204700        "SABLE_ISLAND                  "  43.95  299.90:  1916-1929   [ISPD_dir=ISPD2_2_4/ispd1_1/canadian/sable_isla]

29 8104900        "SAINT_JOHN                    "  45.32  294.12:  1875,1896-1897,1907-1929   [ISPD_dir=ISPD2_2_4/ispd1_1/canadian/saint_jo]

30 8403506        "ST_JOHNS                      "  47.62  307.25:  1852-1862,1866-1870,1873-1876,1906-1929   [ISPD_dir=ISPD2_2_4/ispd1_1/canadian/st_johns]

31 4028040        "SWIFT_CURRENT                 "  50.30  252.32:  1907-1929   [ISPD_dir=ISPD2_2_4/ispd1_1/canadian/swift]

32 8205700        "SYDNEY                        "  46.17  299.83:  1906-1929   [ISPD_dir=ISPD2_2_4/ispd1_1/canadian/sydney]

33 6158733        "TORONTO                       "  43.67  280.40:  1848-1850,1871-1878,1880-1929   [ISPD_dir=ISPD2_2_4/ispd1_1/canadian/toronto]

34 1108447        "VANCOUVER                     "  49.20  236.82:  1922-1929   [ISPD_dir=ISPD2_2_4/ispd1_1/canadian/vancouve]

35 1018610        "VICTORIA                      "  48.40  236.68:  1899-1929   [ISPD_dir=ISPD2_2_4/ispd1_1/canadian/victoria]

36 5023222        "WINNIPEG                      "  49.92  262.77:  1896-1897,1906-1929   [ISPD_dir=ISPD2_2_4/ispd1_1/canadian/winnipeg]

37 8206500        "YARMOUTH                      "  43.83  293.97:  1870-1872,1879-1895,1899-1915,1929   [ISPD_dir=ISPD2_2_4/ispd1_1/canadian/yarmout]

38 pointe_pitre   "Pointe a Pitre, Guadaloupe    "  48.50  291.52:  1875   [ISPD_dir=ISPD30_add/ACRE/pointe_p]

39 st_pauls_is    "St Paul's Island              "  47.20  299.85:  1875-1876   [ISPD_dir=ISPD30_add/ACRE/st_pauls_]

40 york_factory   "York Factory, Canada          "  57.03  267.57:  1875,1878-1879   [ISPD_dir=ISPD30_add/ACRE/york_factory]

41 assistancebay  "Assistance Bay                "  74.67  265.73:  1850-1851   [ISPD_dir=ISPD30_add/EarlyArctic/assistancebay]

42 beecheyisland  "Beechey Island                "  74.72  268.10:  1853-1854   [ISPD_dir=ISPD30_add/EarlyArctic/beecheyi]

43 dealy_island   "Dealy Island                  "  74.93  251.18:  1852-1853   [ISPD_dir=ISPD30_add/EarlyArctic/dealy_i]

44 fort_rae       "Fort Rae                      "  62.65  244.27:  1882-1883   [ISPD_dir=ISPD30_add/EarlyArctic/for]

45 gth            "Godthaab                      "  64.18  308.27:  1882-1883   [ISPD_dir=ISPD30_add/EarlyArctic/gt]

46 kf             "Kingua Fjord                  "  66.60  292.68:  1882-1883   [ISPD_dir=ISPD30_add/EarlyArctic/kf]

47 lfb            "Lady Franklin Bay             "  81.73  295.25:  1881-1883   [ISPD_dir=ISPD30_add/EarlyArctic/lfb]

48 melvillesound  "Melville Sound                "  74.70  258.63:  1853-1854   [ISPD_dir=ISPD30_add/EarlyArctic/me]

49 polaris_bay    "Polaris Bay, Greenland        "  81.60  297.75:  1871-1873   [ISPD_dir=ISPD30_add/EarlyArctic/polaris_bay]

50 polaris_house  "Polaris House                 "  78.30  289.75:  1872-1873   [ISPD_dir=ISPD30_add/EarlyArctic/polaris_hous]

51 port_leopold   "Port Leopold                  "  73.83  269.80:  1848-1849   [ISPD_dir=ISPD30_add/EarlyArctic/port_leop]

52 van_rensselae  "Van Rensselaer Harbor         "  78.62  289.12:  1853-1855   [ISPD_dir=ISPD30_add/EarlyArctic/van]

53 sitka          "Sitka                         "  57.05  224.65:  1843-1867   [ISPD_dir=ISPD30_add/Sitka/sitka]

54 godthaab       "Godthaab, Greenland           "  64.16  308.25:  1875-1883   [ISPD_dir=ISPD40_add/001013_acre/IMB/godth]

55 halifax        "Halifax, Nova Scotia          "  44.60  296.40:  1875-1883   [ISPD_dir=ISPD40_add/001013_acre/IMB/halifa]

56 york_factory   "York Factory, Canada          "  57.03  267.57:  1875-1879   [ISPD_dir=ISPD40_add/001013_acre/IMB/york_factory]

57 killisnoo      "Killisnoo                     "  57.47  229.43:  1888-1891   [ISPD_dir=ISPD40_add/001016_USChcl/Killisnoo/killisnoo]

58 st_johns       "St Johns,Newfoundland         "  47.51  307.34:  1859-1860   [ISPD_dir=ISPD40_add/001018_AustrianISC/Canada/st_johns]

59 toronto_iap    "Toronto Pearson IAP           "  43.68  280.37:  1840-1848   [ISPD_dir=ISPD40_add/001018_AustrianISC/Canada/toronto_iap]

60 toronto        "Toronto                       "  43.66  280.64:  1840-1845   [ISPD_dir=ISPD40_add/001018_AustrianISC/Toronto/toronto]

61 1163780        "Kamloops                      "  50.67  239.67:  1897-1900,1906   [ISPD_dir=ISPD40_add/003004_EnvCanada/1163780]

62 6104146        "Kingston                      "  44.22  283.40:  1872-1879   [ISPD_dir=ISPD40_add/003004_EnvCanada/6104146]

63 6158733        "Toronto                       "  43.68  280.37:  1879   [ISPD_dir=ISPD40_add/003004_EnvCanada/6158733]

64 7016294        "Quebec                        "  46.80  288.62:  1872-1873   [ISPD_dir=ISPD40_add/003004_EnvCanada/7016294]

65 7025250        "Montreal                      "  45.50  286.42:  1876-1895,1897-1899   [ISPD_dir=ISPD40_add/003004_EnvCanada/7025250]

66 7056067        "Father Point                  "  48.50  291.52:  1876-1905,1908   [ISPD_dir=ISPD40_add/003004_EnvCanada/7056067]

67 8101000        "Chatham                       "  47.01  294.53:  1876-1906,1908   [ISPD_dir=ISPD40_add/003004_EnvCanada/8101000]

68 8202200        "Halifax                       "  44.65  296.43:  1877-1878,1883-1885,1887-1895,1897-1900   [ISPD_dir=ISPD40_add/003004_EnvCanada/8202200]

69 8205700        "Sydney                        "  46.17  299.95:  1876-1900   [ISPD_dir=ISPD40_add/003004_EnvCanada/8205]

70 beaver_hall    "32 Beaver Hall Ter,Montreal   "  45.50  286.43:  1868-1873   [ISPD_dir=ISPD40_add/003031_CanadianClimRescue/beaver_hall]

71 great_st-jame  "Great St-James str,Montreal   "  45.50  286.44:  1831-1842   [ISPD_dir=ISPD40_add/003031_CanadianClimRescue/great_s]

72 halifax        "Halifax                       "  44.60  296.40:  1828-1860   [ISPD_dir=ISPD40_add/003031_CanadianClimRescue/halifax]

73 little_st-jam  "Little St-James st,Montreal   "  45.51  286.45:  1842-1852,1862-1868   [ISPD_dir=ISPD40_add/003031_CanadianClimRescue/littl]

74 mt_st          "Mt St Christ Church, Montreal "  45.50  286.42:  1838-1842,1845,1847,1852-1862,1864-1867   [ISPD_dir=ISPD40_add/003031_CanadianClimRescue/mt_st]

75 rue_ste_anne   "Rue Ste Anne,Quebec           "  46.81  288.79:  1803-1819   [ISPD_dir=ISPD40_add/003031_CanadianClimRescue/rue_ste_anne]

76 st-martin_lav  "St Martin Laval,Quebec        "  45.50  286.27:  1853-1862   [ISPD_dir=ISPD40_add/003031_CanadianClimRescue/st-martin_la]

77 york_factory   "32 Beaver Hall Ter,Montreal   "  57.00  267.70:  1828-1832   [ISPD_dir=ISPD40_add/003031_CanadianClimRescue/]

The internal directory is for ISPD tracking, but it does help the user see in what version of ISPD that station was introduced.

For example, entry 77 was added in ISPD version 4.0 (from the ISPD40_add directory name),

while entry 26 was in ISPD version 1.1 and merged into ISPD version 2.2.4 (from the ISPD2_2_4/ispd1_1 name). 


Xungang.Yin

Thu, 09/11/2014 - 12:37

Thank you Yvan. That was a mistake for station 38. Confirmed from scanned image that the station name is correct but the position should be 16.24N, 61.54W, elevation 4 m. I'll correct the metadata in ISPD.

Also the whole list may include a few non-Canadian stations as I used a box to find the Canadian stations and manually removed those apparently non-Canadian stations.

Add new comment

CAPTCHA
This question is for testing whether or not you are a human visitor and to prevent automated spam submissions.

Canadian station data rescue

Created by gilbert.p.comp… on - Updated on 07/18/2016 10:13

This page is for discussing sources of Canadian station data and planning for future data recovery.


A list of stations having data before 1930 in Canada or its vicinity that are expected to be in ISPD version 4 is here.

A list of stations digitized by Environment Canada, Climate Research Research Division is here. Not all of these stations are included in the ISPDv4.

apologies for being a bit late in contributing... I would have been tempted to agree with Vicky on the overhead of correcting poor OCR recognition of tabular data. We made several attempts using ABBY Fineprinter, considered to be one of the best OCR engines, but gave up because of the same issue. However, I've discovered Bytescout which has a module specifically designed to manage tabular data (in .pdf form) conversion to .xls. We ran it across some images of Antarctic data and got manageable results. As it turns out, the Antarctic data has already been digitised and included in the ISPD, so we don't have extended experience with Bytescout.

Bytescout is pretty pricey stuff but they make the pdf to xls module available for free at:
http://bytescout.com/?q=/download/download_freeware.html, and look for PDF Viewer./

If your images are not in pdf, most image viewers will save a jpg (or whatever) as pdf. We use freeware Irfanview for all our image work
and it's never let us down with its exteded capabilities.

and BTW Vicky, Bytescout are fellow Canucks (Vancouver)

Mac
Todd Weather Folios Team
Adelaide, South Australia

victoria.slonosky

Sun, 09/07/2014 - 13:12

From what I understood of the presentation on Tuesday at ACRE, we would have to request the archival documents from the data and archives department of the Meteorological Service of Canada (MSC), and they would retrieve the files from the archive at Western Ontario where they're being stored.

victoria.slonosky

Thu, 09/04/2014 - 19:22

A few months ago a short-list was put together of Canadian locations which we think may have long series of observations and/or are in data sparse regions, which I'll update based on Gil’s station list and notes from last week and post up here. The original files can be retrieved from the current archives by the MSC under the agreement of the long-term loan of the papers. However, once they’re retrieved, something (probably digital scanning or photography?) needs to be done with the paper copies as a first step to retrieving the information. Depending on the number of pages to be scanned, a formal request and financing structure may need to be considered.

One question to consider would be whether to get the information from the printed annual books or from the original stations records, or use a combination. I'm inclined to look at the original records as I think they may have more information and fewer [printing, transcription, etc] errors, but the printed tables might be easier for volunteer digitization.

Vicky, Original sources are always best. I think volunteers working on the original sources will be ok - we need them more for the handwritten. One can always make the argument that Optical Character Recognition would work on the scanned tables, even if the success rate isn't great. What is MSC? best wishes, gil

Add new comment

CAPTCHA
This question is for testing whether or not you are a human visitor and to prevent automated spam submissions.

List of satellite datasets

Created by paul.poli@shom.fr on - Updated on 08/04/2017 15:33

A dataset is defined here as:

  • a data record,
  • from a single instrument,
  • from a single satellite,
  • containing a single observable or geophysical variable.


Please feel free to report omissions or errors, e.g. by submitting comments below.


List of single-instrument, single-satellite, and single-observable data records.
Observable or Geophysical variable Instrument Satellite Time period Reprocessing, if any

Significant wave height

Altimeter

ERS-1

Aug 1991-Jun 1996

ESA  

Significant wave height

Altimeter

ERS-2

May 1995-Jul 2003

ESA  

Significant wave height

Altimeter

ENVISAT

Jul 2003-May 2012


Significant wave height

Altimeter

JASON-1

Oct 2003-Jul 2013


Significant wave height

Altimeter

JASON-2

Mar 2009-present


Backscatter sigma0

SASS

SEASAT

Jul 1978-Oct 1978

NASA JPL Physical Oceanography DAAC (PO.DAAC)


Backscatter sigma0

AMI

ERS-1

Apr 1992-Jul 1997

ESA


Backscatter sigma0

AMI

ERS-2

Nov 1995-Jul 2011,

with long gaps

ESA


Backscatter sigma0

NSCAT

ADEOS-1

Sep 1996-Jun 1997


Backscatter sigma0

SEAWINDS

QUIKSCAT

Feb 2000-Nov 2009


Backscatter sigma0

SEAWINDS

ADEOS-2

Apr 2003-Oct 2003


Backscatter sigma0

ASCAT

METOP-A

Jan 2007-present

EUMETSAT


Backscatter sigma0

SCAT

OCEANSAT-2

Mar 2011-present


Total column ozone

TOMS

NIMBUS-7

Nov 1978-May 1993

NASA v8.6 retrievals

http://ozoneaq.gsfc.nasa.gov/nimbus7Ozone.md


Total column ozone

TOMS

METEOR-3

Aug 1991-Dec 1994

NASA v8.6 retrievals

http://ozoneaq.gsfc.nasa.gov/meteor3Ozone.md


Total column ozone

TOMS

EARTHPROBE

Jul 1996-Dec 2005

NASA v8.6 retrievals

http://ozoneaq.gsfc.nasa.gov/earthProbeOzone.md


Total column ozone

TOMS

ADEOS-1

Oct 1996-Jun1997

NASA v8.6 ?


Total column ozone

SCIAMACHY +

ENVISAT

Aug 2002-Apr 2012

KNMI reprocessed data available for 2008


Total column ozone

OMI +

EOS-AURA

Oct 2004-present

KNMI reprocessed data available for 2008


Total column ozone

GOME-2 +

METOP-A

Jan 2007-Dec 2012

ESA-CCI Ozone ?


Ozone profile

BUV

NIMBUS-4

Apr 1970-May 1977

NASA v8.6 ?


Ozone profile

BUV

AE-E also known as Atmosphere

Explorer 55

Nov 1975-Jun 1981

DATA LOCATION UNKNOWN


Ozone profile

SBUV

NIMBUS-7

Nov 1978-Jun 1990

NASA v8.6 ?


Ozone profile

SBUV/2

NOAA-9

Mar 1985-Feb 1998

NASA v8.6 ?


Ozone profile

SBUV/2

NOAA-11

Jan 1989-May 2003

NASA v8.6 ?


Ozone profile

SBUV/2

NOAA-14

Jan 1996-Jan 2006

NASA v8.6 ?


Ozone profile

SBUV/2

NOAA-16

Oct 2000-Oct 2008

NASA v8.6 ?


Ozone profile

SBUV/2

NOAA-17

Jan 2003-Dec 2011

NASA v8.6 ?


Ozone profile

SBUV/2

NOAA-18

Oct 2005-Dec 2011

NASA v8.6 ?


Ozone profile

SBUV/2

NOAA-19

Jun 2011-present

NASA v8.6 ?


Ozone profile

GOME +

ERS-2

Jan 1996-Dec 2002

ESA CCI Ozone ?


Ozone profile

MLS

UARS

Sep 1991-Aug 2001


Ozone profile

MLS

EOS-AURA

Oct 2004-present


Ozone profile

MIPAS +

ENVISAT

Jul 2002-Apr 2012

ESA CCI Ozone


Ozone profile

FTS

ACE

Mar 2004-Sep 2010

v2.2 (currently being reprocessed after Oct 2010) from http://www.ace.uwaterloo.ca/index.html


Bending angles

GPS radio occultation receiver

GPS/MET

Selected short time periods

in 1995, 1996, 1997

UCAR CDAAC version 2007.3200 reprocessed dataset


Bending angles

GPS radio

occultation receiver

CHAMP

May 2001-Oct 2008

UCAR CDAAC version 2009.2650 reprocessed dataset


Bending angles

GPS radio

occultation receiver

SAC-C

Aug 2001-Nov 2002 and Mar 2006-Aug 2011

UCAR CDAAC version 2010.2640 reprocessed dataset


Bending angles

GPS radio

occultation receiver

GRACE-A

Feb 2007-Jun 2013

(as of 25 Oct 2013)

UCAR CDAAC versions 2009.2650 and 2010.2640 reprocessed datasets


Bending angles

GPS radio

occultation receiver

COSMIC FM-1

Jul 2006-Jun 2013

(as of 25 Oct 2013)

UCAR CDAAC version 2010.2640 reprocessed dataset


Bending angles

GPS radio

occultation receiver

COSMIC FM-2

Jul 2006-Jun 2013

(as of 25 Oct 2013)

UCAR CDAAC version 2010.2640 reprocessed dataset


Bending angles

GPS radio

occultation receiver

COSMIC FM-3

Jul 2006-Jul 2010

(as of 25 Oct 2013)

UCAR CDAAC version 2010.2640 reprocessed dataset


Bending angles

GPS radio

occultation receiver

COSMIC FM-4

Jul 2006-Jun 2013

(as of 25 Oct 2013)

UCAR CDAAC version 2010.2640 reprocessed dataset


Bending angles

GPS radio

occultation receiver

COSMIC FM-5

Jul 2006-Jun 2013

(as of 25 Oct 2013)

UCAR CDAAC version 2010.2640 reprocessed dataset


Bending angles

GPS radio

occultation receiver

COSMIC FM-6

Jul 2006-Jun 2013

(as of 25 Oct 2013)

UCAR CDAAC version 2010.2640 reprocessed dataset


Bending angles

GPS radio

occultation receiver

TERRASAR-X

Feb 2008-Dec 2012

UCAR CDAAC version 2010.2640 reprocessed dataset


Bending angles

GPS radio

occultation receiver

C/NOFS

Mar 2010-Dec 2011

UCAR CDAAC version 2010.2640 reprocessed dataset


Bending angles

GPS radio

occultation receiver

METOP-A

Sep 2007-Dec 2011

UCAR CDAAC version 2011.2980 reprocessed dataset


Atmospheric Motion Vector (AMV)


METEOSAT-1

Dec 1978-Nov 1979


Atmospheric Motion Vector (AMV)

MVIRI

METEOSAT-2

May 1982-Aug 1988

EUMETSAT


Atmospheric Motion Vector (AMV)

MVIRI

METEOSAT-3

Jan 1989-Jan 1991 / Jan 1993-May 1995 (XADC)

EUMETSAT


Atmospheric Motion Vector (AMV)

MVIRI

METEOSAT-4

Jun 1989-Fev 1994

EUMETSAT


Atmospheric Motion Vector (AMV)

MVIRI

METEOSAT-5

Nov 1991-Feb 2007

EUMETSAT for Nov 1991-Feb 1997/June 1998-Dec 2000


Atmospheric Motion Vector (AMV)

MVIRI

METEOSAT-6

Fev 1997- Jun 1998 (+ few dates in Jan 99 and Jan 2000)

EUMETSAT


Atmospheric Motion Vector (AMV)

MVIRI

METEOSAT-7

June 1998-present

EUMETSAT for June 1998-Dec 2000


Atmospheric Motion Vector (AMV)

SEVIRI

METEOSAT-8

Mar 2004-present

EUMETSAT


Atmospheric Motion Vector (AMV)

SEVIRI

METEOSAT-9

Jun 2006-present

EUMETSAT


Atmospheric Motion Vector (AMV)


GOES

Before 1995


Atmospheric Motion Vector (AMV)


GOES

After 1995

CIMSS


Atmospheric Motion Vector (AMV)


GOES-9

May 2003-Jun 2005

JMA


Atmospheric Motion Vector (AMV)


GMS-1

Jan 1979-Nov 1984

JMA for Jan 1979-Nov 1979


Atmospheric Motion Vector (AMV)


GMS-3

Dec 1984-Feb 1987

JMA for Mar 1987-Dec 1989


Atmospheric Motion Vector (AMV)


GMS-4

Dec 1989-Jun 1995

JMA


Atmospheric Motion Vector (AMV)


GMS-5

Jun 1995-May 2003

JMA


Atmospheric Motion Vector (AMV)


MTSAT-1R

Jun 2005-Sep 2009

JMA


Atmospheric Motion Vector (AMV)

AVHRR

NOAA-7

Jan 1982-Fev 1985

CIMSS

ftp://stratus.ssec.wisc.edu/pub/winds/histavhrr/newversion/noaa-7/


Atmospheric Motion Vector (AMV)

AVHRR

NOAA-9

Fev 1985-Nov 1988

CIMSS

ftp://stratus.ssec.wisc.edu/pub/winds/histavhrr/newversion/noaa-9/


Atmospheric Motion Vector (AMV)

AVHRR

NOAA-10

Nov 1986-Sep 1991

CIMSS

ftp://stratus.ssec.wisc.edu/pub/winds/histavhrr/newversion/noaa-10/


Atmospheric Motion Vector (AMV)

AVHRR

NOAA-11

Nov 1998-Sep 1994

CIMSS

ftp://stratus.ssec.wisc.edu/pub/winds/histavhrr/newversion/noaa-11/


Atmospheric Motion Vector (AMV)

AVHRR

NOAA-12

Sep 1991-Dec 1998

CIMSS

ftp://stratus.ssec.wisc.edu/pub/winds/histavhrr/newversion/noaa-12/


Atmospheric Motion Vector (AMV)

AVHRR

NOAA-14

Fev 1995-Dec 2000

CIMSS

ftp://stratus.ssec.wisc.edu/pub/winds/histavhrr/newversion/noaa-14/


Atmospheric Motion Vector (AMV)

AVHRR

NOAA-15

Dec 1999-Dec 2002

CIMSS

ftp://stratus.ssec.wisc.edu/pub/winds/histavhrr/newversion/noaa-15/


Atmospheric Motion Vector (AMV)

AVHRR

NOAA-16

Jan 2001-Nov 2007

CIMSS

ftp://stratus.ssec.wisc.edu/pub/winds/histavhrr/newversion/noaa-16/


Atmospheric Motion Vector (AMV)

AVHRR

NOAA-17

Oct 2002-Dec 2009

CIMSS

ftp://stratus.ssec.wisc.edu/pub/winds/histavhrr/newversion/noaa-17/


Atmospheric Motion Vector (AMV)

AVHRR

NOAA-18

May 2005-Dec 2010

CIMSS, though no data for 2007 and 2008

ftp://stratus.ssec.wisc.edu/pub/winds/histavhrr/newversion/noaa-18/


Atmospheric Motion Vector (AMV)

AVHRR

METOP-A

Jan 2007-Dec 2012

EUMETSAT


Atmospheric Motion Vector (AMV)

MODIS

EOS-Terra

Jan 2000-present


Atmospheric Motion Vector (AMV)

MODIS

EOS-Aqua

Jun 2002-present


Brightness temperature

HRIR

NIMBUS-1

Aug 1964-Sep 1964

NASA https://disc.gsfc.nasa.gov/uui/datasets/HRIRN1L1_V001/summary?keywords=…


Brightness temperature

HRIR

NIMBUS-2

May 1966-Nov 1966

NASA https://disc.gsfc.nasa.gov/uui/datasets/HRIRN2L1_V001/summary?keywords=…


Brightness temperature

HRIR

NIMBUS-3

Apr 1969-Mar 1970

NASA https://disc.gsfc.nasa.gov/uui/datasets/HRIRN3L1_V001/summary?keywords=…


Brightness temperature

MRIR

NIMBUS-2

May 1966-Jul 1966

NASA https://disc.gsfc.nasa.gov/uui/datasets/MRIRN2L1_V001/summary?keywords=…


Brightness temperature

MRIR

NIMBUS-3

Apr 1969-Feb 1970

NASA https://disc.gsfc.nasa.gov/uui/datasets/MRIRN3L1_V001/summary?keywords=…


Brightness temperature

THIR

NIMBUS-4

Apr 1970-Apr 1971

NASA https://disc.gsfc.nasa.gov/uui/datasets/THIRN4L1CH115_V001/summary?keyw… https://disc.gsfc.nasa.gov/uui/datasets/THIRN4L1CH67_V001/summary?keywo…


Brightness temperature

THIR

NIMBUS-5

Dec 1972-Mar 1975

NASA https://disc.gsfc.nasa.gov/uui/datasets/THIRN5L1CH115_V001/summary?keyw… https://disc.gsfc.nasa.gov/uui/datasets/THIRN5L1CH67_V001/summary?keywo…


Brightness temperature

THIR

NIMBUS-6

Jun 1975-Aug 1977

NASA https://disc.gsfc.nasa.gov/uui/datasets/THIRN6L1CH115_V001/summary?keyw… https://disc.gsfc.nasa.gov/uui/datasets/THIRN6L1CH67_V001/summary?keywo…


Brightness temperature

THIR

NIMBUS-7

Oct 1978-May 1985

NASA https://disc.gsfc.nasa.gov/uui/datasets/THIRN7L1CLDT_V001/summary?keywo…


Brightness temperature

SIRS-A

NIMBUS-3

Apr 1969-Jun 1970

UCAR http://rda.ucar.edu/datasets/ds685.0


Brightness temperature

SIRS-B

NIMBUS-4

Apr 1970-Apr 1971

UCAR http://rda.ucar.edu/datasets/ds685.0


Brightness temperature

SSH

DMSP block 5D F-1

Sep 1976-Sep 1979

DATA LOCATION UNKNOWN


Brightness temperature

SSH

DMSP block 5D F-2

Jun 1977-Jun 1978

DATA LOCATION UNKNOWN


Brightness temperature

SSH

DMSP block 5D F-3

Apr 1978-Dec 1979

DATA LOCATION UNKNOWN


Brightness temperature

SSH

DMSP block 5D F-4

Jun 1979-Aug 1980

DATA LOCATION UNKNOWN


Brightness temperature

VTPR

NOAA-2

Jan 1973-Oct 1974


Brightness temperature

VTPR

NOAA-3

Mar 1974-Dec 1974


Brightness temperature

VTPR

NOAA-4

Dec 1974-Sep 1976


Brightness temperature

VTPR

NOAA-5

Sep 1976-Dec 1978


Brightness temperature

HIRS/1

NIMBUS-6

Aug 1975-Mar 1976

NASA https://disc.gsfc.nasa.gov/uui/datasets/HIRSN6L1GARP_V001/summary?keywo…


Brightness temperature

HIRS/2

TIROS-N

Jan 1979-Feb 1981


Brightness temperature

HIRS/2

NOAA-6

Jul 1979-Apr 1983


Brightness temperature

HIRS/2

NOAA-7

Jul 1981-Feb 1985


Brightness temperature

HIRS/2

NOAA-8

Apr 1983-Jun 1984


Brightness temperature

HIRS/2

NOAA-9

Dec 1984-Nov 1988


Brightness temperature

HIRS/2

NOAA-10

Nov 1986-Sep 1991


Brightness temperature

HIRS/2

NOAA-11

Oct 1988-Apr 2000


Brightness temperature

HIRS/2

NOAA-12

Jul 1991-May 1997


Brightness temperature

HIRS/2

NOAA-14

Apr 1995-Dec 2004


Brightness temperature

HIRS/3

NOAA-15

Aug 1998-Jun 2000


Brightness temperature

HIRS/3

NOAA-16

Oct 2000-May 2004


Brightness temperature

HIRS/3

NOAA-17

Jul 2002-Dec 2011


Brightness temperature

HIRS/4

NOAA-18

DO NOT USE


Brightness temperature

HIRS/4

NOAA-19

Jun 2009-Dec 2011


Brightness temperature

HIRS/4

METOP-A

Feb 2007-Dec 2011


Brightness temperature

SCR

NIMBUS-4

Jun 1970-Oct 1972

University of Oxford Atmospheric, Oceanic, and Planetary Physics Department in 2011 (data curated by project SEEDCORN)

Copy of the data now at ECMWF


Brightness temperature

SCR

NIMBUS-5

Dec 1972-Mar 1978

University of Oxford Atmospheric, Oceanic, and Planetary Physics Department in 2011 (data curated by project SEEDCORN)

Copy of the data now at ECMWF


Brightness temperature

PMR

NIMBUS-6

Jun 1975-Jun 1978

University of Oxford Atmospheric, Oceanic, and Planetary Physics Department in 2011 (data curated by project SEEDCORN)

Copy of the data now at ECMWF


Brightness temperature

SSU

TIROS-N

Oct 1978-Feb 1981


Brightness temperature

SSU

NOAA-6

Jul 1979-Oct 1986


Brightness temperature

SSU

NOAA-7

Jun 1981-Feb 1985


Brightness temperature

SSU

NOAA-8

Apr 1983-Oct 1985


Brightness temperature

SSU

NOAA-9

Dec 1984-Nov 1988


Brightness temperature

SSU

NOAA-11

Sep 1988-Jan 2003


Brightness temperature

SSU

NOAA-14

Jan 1995-May 2006


Brightness temperature

IRIS-B

NIMBUS-3

Apr 1969-Jul 1969


Brightness temperature

IRIS-D

NIMBUS-4

Apr 1970-Jan 1971

Data curated by NASA GES DISC


Brightness temperature

SI-1

METEOR-28

Jul 1977-Sep 1977

Data on the personal computers of the PIs, Wolfgang Döhler and Dieter Oertel


Brightness temperature

SI-1

METEOR-29

Jan 1979-May 1979

Data on the personal computers of the PIs, Wolfgang Döhler and Dieter Oertel


Brightness temperature

IMG

ADEOS-1

Oct 1996-Aug 1997

JAXA or NASA JPL ?


Brightness temperature

AIRS

EOS-Aqua

May 2002-present

NASA JPL AIRS v5 or v6 reprocessed dataset of L1B


Brightness temperature

IASI

METOP-A

Jan 2007-Dec 2011


Brightness temperature

Imager

GMS-5

Jun 1995-May 2003

JMA


Brightness temperature

Imager

GOES-9

May 2003-Jun 2005

JMA


Brightness temperature

Imager

MTSAT-1R

Jun 2005-Dec 2009

JMA


Brightness temperature

MVIRI

METEOSAT-2

May 1982-Aug 1988

EUMETSAT


Brightness temperature

MVIRI

METEOSAT-3

Aug 1988-Jan 1991 / Aug 1991-Jan 1993 (ADC) / Aug 1993-Dec 1995 (XADC)

EUMETSAT


Brightness temperature

MVIRI

METEOSAT-4

Jun 1989-Feb 1994

EUMETSAT


Brightness temperature

MVIRI

METEOSAT-5

Feb 1994-Feb 2007

EUMETSAT for Feb 1994-Feb 1997 / Jun 1998-Dec 2000 (IOC)


Brightness temperature

MVIRI

METEOSAT-6

Oct 1996-Jun 1988

EUMETSAT


Brightness temperature

MVIRI

METEOSAT-7

June 1998-present

EUMETSAT for June 1998-Dec 2000


Brightness temperature

SEVIRI

METEOSAT-8

Mar 2004-present

EUMETSAT


Brightness temperature

SEVIRI

METEOSAT-9

Jun 2006-present

EUMETSAT


Brightness temperature

ESMR

NIMBUS-5

Dec 1972-May 1977

NASA https://disc.gsfc.nasa.gov/uui/datasets/ESMRN5L1_V001/summary?keywords=…


Brightness temperature

SCAMS

NIMBUS-6

Jun 1975-May 1976

NASA https://disc.gsfc.nasa.gov/datasets/SCAMSN6L2_V001/


Brightness temperature

SSH-2

DMSP block 5D F-6

Dec 1982-Aug 1987

DATA LOCATION UNKNOWN


Brightness temperature

SSMT

DMSP block 5D F-7

Nov 1983-Sep 2002

DATA LOCATION UNKNOWN


Brightness temperature

SSMT

DMSP block 5D F-8

Jun 1987-Aug 1994

DATA LOCATION UNKNOWN


Brightness temperature

SSH-2 according to NASA,

but SSMT according to

all other sources

DMSP block 5D F-9

Feb 1988-Apr 1992

DATA LOCATION UNKNOWN


Brightness temperature

SAMS

Nimbus-7

Mar 1979-May 1983

University of Oxford Atmospheric, Oceanic, and Planetary Physics Department in 2011 (data curated by project SEEDCORN)

Copy of the data now at ECMWF


Brightness temperature

SSMT

DMSP block 5D F-10

Apr 1992-Nov 1997

NOAA NGDC (neither reprocessed nor re-acquired from original agency)

Note: data should be archived elsewhere for the beginning of the mission, from Dec 1990


Brightness temperature

SSMT

DMSP block 5D F-11

Apr 1992-May 2000

NOAA NGDC (neither reprocessed nor re-acquired from original agency)

Note: data should be archived elsewhere for the beginning of the mission, from Nov 1991


Brightness temperature

SSMT

DMSP block 5D F-12

Sep 1994-Nov 1995

NOAA NGDC (neither reprocessed nor re-acquired from original agency)


Brightness temperature

SSMT

DMSP block 5D F-13

Apr 1995-Nov 2009

NOAA NGDC (neither reprocessed nor re-acquired from original agency)


Brightness temperature

SSMT

DMSP block 5D F-14

Apr 1997-Jul 1997

NOAA NGDC (neither reprocessed nor re-acquired from original agency)


Brightness temperature

SSMT

DMSP block 5D F-15

Jan 2000-present

NOAA NGDC (neither reprocessed nor re-acquired from original agency)


Brightness temperature

MSU

TIROS-N

Oct 1978-Feb 1981


Brightness temperature

MSU

NOAA-6

Jul 1979-Oct 1986


Brightness temperature

MSU

NOAA-7

Jul 1981-Feb 1985


Brightness temperature

MSU

NOAA-8

Apr 1983-Oct 1985


Brightness temperature

MSU

NOAA-9

Dec 1984-Mar 1987


Brightness temperature

MSU

NOAA-10

Nov 1986-Sep 1991


Brightness temperature

MSU

NOAA-11

Sep 1988-Feb 1999


Brightness temperature

MSU

NOAA-12

Jul 1991-May 1997


Brightness temperature

MSU

NOAA-14

Apr 1995-Sep 2006


Brightness temperature

AMSU-A

NOAA-15

Aug 1998-Dec 2011


Brightness temperature

AMSU-A

NOAA-16

Oct 2000-Jun 2009


Brightness temperature

AMSU-A

NOAA-17

Jul 2002-Oct 2003


Brightness temperature

AMSU-A

NOAA-18

Jul 2005-Dec 2011


Brightness temperature

AMSU-A

NOAA-19

Jun 2009-Dec 2011


Brightness temperature

AMSU-A

EOS-Aqua

Dec 2002-Dec 2011


Brightness temperature

AMSU-A

METOP-A

Jan 2007-Dec 2011


Brightness temperature

SMMR

SEASAT

Jul 1978-Oct 1978

DATA LOCATION UNKNOWN


Brightness temperature

SMMR

NIMBUS-7

Oct 1978-Aug 1987

RSS and/or CSU and/or CM-SAF may have copies of L1 data


Brightness temperature

SSM/I

DMSP block 5D F-8

Sep 1987-Dec 1991

CM-SAF

http://wui.cmsaf.eu/safira/action/viewDoiDetails?acronym=FCDR_SSMI_V001


Brightness temperature

SSM/I

DMSP block 5D F-10

Jan 1991-Nov 1997

Note: dataset used in ERA-Interim is shorter

(Jan 1992-Jan 1993)

CM-SAF

http://wui.cmsaf.eu/safira/action/viewDoiDetails?acronym=FCDR_SSMI_V001


Brightness temperature

SSM/I

DMSP block 5D F-11

Jan 1992-Dec 1999

Note: dataset used in ERA-Interim is shorter

(Jan 1993-Jan 1996)

CM-SAF

http://wui.cmsaf.eu/safira/action/viewDoiDetails?acronym=FCDR_SSMI_V001


Brightness temperature

SSM/I

DMSP block 5D F-13

May 1995-Dec 2008

Note: dataset used in ERA-Interim extends to 2009

(Jan 1996-Nov 2009)

CM-SAF

http://wui.cmsaf.eu/safira/action/viewDoiDetails?acronym=FCDR_SSMI_V001


Brightness temperature

SSM/I

DMSP block 5D F-14

May 1997-Aug 2008

Note: dataset used in ERA-Interim is shorter

(Jun 1999-Aug 2008)

CM-SAF

http://wui.cmsaf.eu/safira/action/viewDoiDetails?acronym=FCDR_SSMI_V001


Brightness temperature

SSM/I

DMSP block 5D F-15

Feb 2000-Jul 2006

Note: dataset used in ERA-Interim is shorter

(Jul 2000-Aug 2006)

CM-SAF

http://wui.cmsaf.eu/safira/action/viewDoiDetails?acronym=FCDR_SSMI_V001


Brightness temperature

SSM/I-S

DMSP block 5D F-16

Nov 2005-Sep 2013

(as of 25 Oct 2013)

CM-SAF, or CSU

http://rain.atmos.colostate.edu/FCDR/


Brightness temperature

SSM/I-S

DMSP block 5D F-17

Mar 2008-Sep 2013

(as of 25 Oct 2013)

CM-SAF, or CSU

http://rain.atmos.colostate.edu/FCDR/


Brightness temperature

SSM/I-S

DMSP block 5D F-18

Mar 2010-Sep 2013

(as of 25 Oct 2013)

CM-SAF, or CSU

http://rain.atmos.colostate.edu/FCDR/


Brightness temperature

TMI

TRMM

Dec 1997-Dec 2011

JAXA


Brightness temperature

AMSR

ADEOS-2

Jan 2003-Oct 2003

JAXA


Brightness temperature

AMSR-E

EOS-AQUA

May 2002-Oct 2011

JAXA


Brightness temperature

SSM/T-2

DMSP block 5D F-11

Jan 1993-May 2000

Note: NOAA NGDC seems to have data before 1993,

from Apr 1992 (http://ngdc.noaa.gov/eog/availability.html)

Met Office


Brightness temperature

SSM/T-2

DMSP block 5D F-12

Sep 1994-Jan 2002

Met Office


Brightness temperature

SSM/T-2

DMSP block 5D F-14

Apr 1997-Oct 2006

Note: NOAA NGDC seems to have data after 2006,

until Aug 2008 (http://ngdc.noaa.gov/eog/availability.html)

Met Office


Brightness temperature

SSM/T-2

DMSP block 5D F-15

Aug 2000-May 2008

Note: NOAA NGDC seems to have data after 2008,

until present (http://ngdc.noaa.gov/eog/availability.html)

Met Office


Brightness temperature

AMSU-B

NOAA-15


ERA and JRA DO NOT USE


Brightness temperature

AMSU-B

NOAA-16

Oct 2000-Sep 2007


Brightness temperature

AMSU-B

NOAA-17

Aug 2002-Dec 2009


Brightness temperature

HSB

EOS-Aqua

May 2002-Feb 2003

NASA JPL AIRS v5 or v6 reprocessed dataset of L1B


Brightness temperature

MHS

NOAA-18

Jul 2005-Dec 2011


Brightness temperature

MHS

NOAA-19

Jun 2009-Dec 2011


Brightness temperature

MHS

METOP-A

Jan 2007-Dec 2011


Add new comment

CAPTCHA
This question is for testing whether or not you are a human visitor and to prevent automated spam submissions.

The Tropical Cyclone Candidate Event Project: A global dataset of reanalysis-derived tropical cyclone candidate events for 1871-1979

Created by ret08 on - Updated on 08/09/2016 11:28

Truchelut, R., R. Hart, and B. Luthman, 2013: Global identification of previously undetected pre-satellite era tropical cyclone candidates in NOAA/CIRES 20th Century Reanalysis data. J. Appl. Meteor. Climatol. doi:10.1175/JAMC-D-12-0276.1.

For full documentation and results of the project, please visit: http://moe.met.fsu.edu/tcce/

Project Abstract

Prior to the satellite era, limited synoptic observation networks led to an indefinite number of tropical cyclones (TCs) remaining undetected. This period of decreased confidence in the TC climatological record includes the first two-thirds of the 20th Century. While prior studies found this undersampling exists, disagreement regarding its magnitude has caused difficulties in interpreting multi-decadal changes in TC activity.


Previous research also demonstrated that reanalyses can be used to extend TC climatology, utilizing the NOAA/CIRES 20th Century Reanalysis to manually identify previously unknown Atlantic Basin potential TCs. The results significantly expand upon the scope of the earlier work, using a filtering algorithm to identify TC candidate events in all tropical basins for the years 1871-1979. The result is the first quantitative and objective global TC candidate event counts for the decades prior to formal recordkeeping.


Verification using ship reports and other in situ observations performed on a subset of the events indicates that the algorithm identifies potential missing TCs at a success rate of 25%-50%, depending on the basin. As our team has performed the verification process on only a small fraction of the thousands of candidate events identified, maps have been made publically available containing model and observational data produced at 6 hour intervals for each candidate event. These images, as well as full documentation of our research procedures, is provided at the links above. It is our hope that ongoing and future TC climatology revision efforts will use this data as a source of independent guidance in order to produce a more complete record of historical tropical cyclone activity.

We hope you find our work useful, and please do not hesitate to contact us directly with questions or specific data requests.

Ryan Truchelut (ret08@fsu.edu) and Robert Hart (rhart@fsu.edu)

Florida State University Meteorology


Tracks of potential mising Atlantic Basin TCs, 1951-1966.


Add new comment

CAPTCHA
This question is for testing whether or not you are a human visitor and to prevent automated spam submissions.

Marine data rescue

Created by catharine on - Updated on 07/18/2016 10:13

This page has been created to provide a forum for those working in the field of marine data rescue to highlight to the Community newly identified sources of data and to discuss how they might be used to fill existing temporal or geographical gaps in the record or where helpful; enhance existing records (e.g. sub daily data rather than daily).

Please add any findings or thoughts in the comments below. Where relevant, please add URL's and give a quick summary of the time period, geographical region(s) covered and types of observations the source contains.

The RECovery of Logbooks And International Marine data (RECLAIM)--a cooperative international project to locate and image historical ship logbooks and related marine data and metadata from archives across the globe, and to digitize the meteorological and oceanographic observations for merger into ICOADS.

Christa Pudmenzky (not verified)

Tue, 04/15/2014 - 02:14

Every year the Australian Broadcasting Corporation (ABC) runs an ABC Science's National Science Week Citizen Science Project. I have submitted a proposal to get the thousands of Clement Wragge’s historical ship logbook images I have photographed digitised. My proposal has been successful. The project will run for the months of August. The aim of this project is to make a major contribution to ACRE initiative by involving as many ‘citizen scientists’ as possible in digitising thousands photographed ship logbook weather extracts dating from 1882 to 1903, that were collected by Clement Wragge, the former Government Meteorologist of Queensland. These log extracts cover the immediate Australasian region and also capture ships traversing the Atlantic, Indian and Pacific oceans. Each image has recordings of locations, sea surface and air temperatures, barometric pressure, wind direction and other interesting observations e.g. location of pack ice, sun spots etc. The information from hundreds or thousands of points of weather measurements made from ships will contribute to the improvement of climate model projections and markedly extend international databases and baselines of global weather and extremes. Christa Pudmenzky International Centre for Applied Climate Sciences (ICACS) University of Southern Queensland Toowoomba, Queensland, 4350, Australia

catharine

Thu, 02/07/2013 - 06:26

A digital version of the logbook kept by William Wales on board HMS Resolution during the passage to the South Seas under the command of Captain James Cook is now available on line. The log has been digitized by the JISC-supported project, ‘Navigating Eighteenth Century Science and Technology: the Board of Longitude’.

http://cudl.lib.cam.ac.uk/view/MS-RGO-00014-00058/1

18th Century data for North Atlantic, South Atlantic, Antarctic Circle, Pacific.
Date range - 21st June 1772 – 30th July 1775.
Observations - Daily barometer and thermometer observations.

Add new comment

CAPTCHA
This question is for testing whether or not you are a human visitor and to prevent automated spam submissions.

Satellite

Created by paul.poli@shom.fr on - Updated on 07/18/2016 10:13

Satellite observations in reanalyses

Dataset overview relevant to atmospheric reanalyses

Visit the following page for a list of about 190 satellite datasets.

Usage overview in atmospheric reanalyses

Instrument,

Observable
CFSR MERRA JRA-25 JRA-55 ERA-Interim
Overview of satellite data usage in a few of the modern atmospheric global reanalyses
MSU,

radiances
ch. 1,2,3,4

For NOAA-10 to -14, NESDIS SNO corrected calibration coefficients; Exclusions: tighten qc limits in tropics and over high terrain; window test ch. 2
ch. 1,2,3,4

NESDIS SNO corrected calibration coefficients;

Exclusions: snow, ice, mixed surfaces for ch. 1,2
ch. 2, 3, 4

Exclusions: land or rain for ch. 2-3
ch. 2, 3, 4

Exclusions: land or rain for ch. 2, land for ch. 3
ch. 2, 3, 4

Exclusions: land or rain for ch. 2, land for ch. 3
AMSU-A,

radiances
ch. 1-13, 15

Exclusions: estimated cloud liquid water large for ch. 1-5, 15;  Scattering index too large for ch. 1-6, 15; Channel 4 gross check large for ch. 1-5,15; Ch. 6 gross check large for ch. 1-6,15; Over high orography (> 2000m) for ch. 1-5, 15; large fit to emissivity or Ts for ch. 1-5, 15
ch.1-15

Exclusions: snow, ice, mixed surfaces for ch. 1-6,15, no offset bias correct for ch.14
ch. 4-13

Exclusions: sea-ice or land for ch. 4-5, high terrain for ch. 6-7, rain for ch4-6
ch. 4-14

Exclusions: sea-ice or land for ch. 4-5, high terrain for ch.6-7, rain for ch4-8
ch. 5-14 Exclusions: high terrain for ch. 5-6, rain for ch. 5-7, no offset bias correct for ch14
AMSU-B / MHS,

radiances
ch. 1-5

Exclusions: scattering index too large, channel 1 fit too large, any channel failing gross check, high orography (>2000m).
ch. 1-5

Exclusions: snow, ice, mixed surfaces for ch. 1,2,5
ch. 3-5

Exclusions: land, sea-ice, rain
ch. 3-5

Exclusions: land, sea-ice, rain
ch. 3-5

Exclusions: sea-ice, rain, high terrain for ch. 3-4,  land for ch. 5
SSMI,

radiances
  ch. 1-7

Ocean only
  ch. 1,3,4,6

Exclusions: land, rain
ch. 1-7

Exclusions: land, rain

HIRS,

radiances

ch. 2-15

Exclusions: Over water wavenumbers > 2400 during day; high orography (> 2000);  above model top; only use channels with signal above clouds; surface sensing channels with large difference.
ch. 2-15

Exclusions: land for channels 5-8
ch. 2-7, 11, 12, 14, 15

Exclusions: clouds or land for ch. 4 and above
ch. 2-7, 11, 12, 14, 15

Exclusions: land for ch. 4-7, 11, 14, 15, high terrain for ch. 12, clouds for ch. 3 and above
ch. 2-7, 11, 12, 14, 15.

Exclusions: clouds, land for ch. 4-7, 11, 14, 15, high terrain for ch. 12
SSU,

radiances
ch. 1,2,3

All channels bias-corrected.
ch.1,2,3

No offset bias correct. for ch.3
ch. 1,2,3 ch. 1,2,3 ch. 1,2,3

No offset bias correct. for ch.3
GEO,

radiances
GOES sounder, 5x5 1993-2007, 1x1 2007- GOES sounder   GOES, METEOSAT, GMS, MTSAT imagers GOES, METEOSAT, MTSAT imagers
SSMI,

retrievals
Surface wind speed above oceans Surface wind speed above oceans, Rain rate Total column water vapor, Snow cover Snow cover Total column water vapor in rainy areas above oceans

Imager,

upper-air winds

GOES, METEOSAT, GMS, MTSAT, MODIS GOES, METEOSAT, GMS, MODIS GOES, METEOSAT, GMS, MTSAT, MODIS GOES, METEOSAT, GMS, MTSAT, MODIS GOES, METEOSAT, GMS, MTSAT, MODIS
Scatterometer,

winds above ocean surface
ERS, Quikscat, ASCAT ERS, Quikscat ERS, Quikscat, ASCAT ERS, Quikscat, ASCAT ERS, Quikscat
Ozone sensors,

retrievals
SBUV V8 Retrievals SBUV V8 Retrievals TOMS, OMI (nudging) TOMS, OMI (nudging) TOMS, SBUV, GOME, MIPAS, SCIAMACHY, MLS, OMI
Other notable elements AIRS, IASI, GPS radio occultation, AMSR-E, reprocessed ERS, reprocessed GMS, AMSU-B NOAA-15 TMI rain rate, AIRS, AMSU-B NOAA-15 Reprocessed GMS winds, AMSR-E Total column water vapor, HIRS NOAA-15 and later not used Reprocessed winds

from GMS/GOES-

9/MTSAT (revised) and

METEOSAT,

Reprocessed

radiances from

GMS/GOES-

9/MTSAT, TMI (from US),

AMSR-E (from JAXA), GPS radio

occultation, SSMIS,

VTPR, HIRS NOAA-

15 and later not used
GPS radio occultation, AIRS, SSM/I-S, AMSR-E, HIRS NOAA-18
Input checked by J.Woollen, B.Kistler, D.Kleist, J.Derber R. Gelaro,

M.  Bosilovich
S. Kobayashi S. Kobayashi P. Poli

Reprocessing

Coordination meeting in the framework of EU FP7 Core-Climax and EU FP7 ERA-CLIM on the reprocessing of GOES, METEOSAT, and AVHRR into atmospheric motion vector (AMV) winds (as well as clear-sky and all-sky radiances for METEOSAT). View the report here.


Lingxiao Wang (not verified)

Tue, 05/12/2015 - 09:16

Hi,I have some questions about satellite observations in reanalyses. Among those observations, that is related to precipitation only SSM/I ? Is there other satellite dataset adopted for making precipitation more accurate?Thanks!

michael.bosilovich

Wed, 05/20/2015 - 11:23

In reply to by Lingxiao Wang (not verified)

In one sense, all the data assimilated is intended to make precipitation better. Consider that precipitation from reanalysis is derived from the background model forecasts, not the analysis of state fields to initialize the forecast. Any observation that improves the forecast, should improve the precipitation. That said, precipitation can be influenced by the water vapor assimilation.

Add new comment

CAPTCHA
This question is for testing whether or not you are a human visitor and to prevent automated spam submissions.