Observations

Observational studies

Created by eca on - Updated on 07/18/2016 10:13

This page provides a sampling of recent research using observations related to reanalyses.*

ECA&D dataset: 

  • Original paper: Klein Tank, A.M.G. and et al., 2002. Daily dataset of 20th-century surface air temperature and precipitation series for the European Climate Assessment. Int. J. Climatol., 22, 1441-1453, doi:10.1002/joc.773
  • Paper updated dataset: Klok, E.J. and A.M.G. Klein Tank, 2009. Updated and extended European dataset of daily climate observations. Int. J. Climatol., 29, 1182, doi:10.1002/joc.1779.

E-OBS dataset:

  • Temperature and precipitation: Haylock, M.R., N. Hofstra, A.M.G. Klein Tank, E.J. Klok, P.D. Jones, and M. New, 2008, A European daily high-resolution gridded data set of surface temperature and precipitation for 1950-2006. J. Geophys. Res., 113, D20119, doi:10.1029/2008JD010201.
  • Sea level pressure: van den Besselaar, E.J.M., M.R. Haylock, G. van der Schrier, A.M.G. Klein Tank, 2011, A European Daily High-resolution Observational Gridded Data set of Sea Level Pressure, J. Geophys. Res., 116, D11110, doi:10.1029/2010JD015468

Research papers (by topic):

Circulation


  • Circulation and temperature extremes: van den Besselaar, E.J.M., A.M.G. Klein Tank, G. van der Schrier, 2010. Influence of circulation types on temperature extremes in Europe. Theor. Appl. Climatol., 99, 431-439, doi:10.1007/s00704-009-0153-6
  • Walker circulation:  L'Heureux, M.L., S. Lee, and B. Lyon, 2013. Recent multidecadal strengthening of the Walker circulation across the tropical Pacific.  Nature Clim Change, doi:10.1038/nclimate1840. Discussion Page.
  • Winds near the surface. Kent, E. C., Fangohr, S. and Berry, D. I., 2012: A comparative assessment of monthly mean wind speed products over the global ocean. Int. J. Climatol., in press, doi:10.1002/joc.3606.

  Datasets/Analysis Methods

  • High resolution global hourly near surface air temperature: Wang, A., X. Zeng, 2013: Development of globaly hourly 0.5-degree land surface air temperature datasets. J. Climate, in press, doi:10.1175/JCLI-D-12-00682.1. Discussion page
  • E-OBS evaluation paper: Hofstra, N., M. Haylock, M. New, P.D. Jones, 2009. Testing E-OBS European high-resolution gridded dataset of daily precipitation and surface temperature. J. Geophys. Res., 114, D21101, doi:10.1029/2009JD011799
  • Effect of GTS data on climate series: van den Besselaar, E.J.M, A.M.G. Klein Tank, G. van der Schrier, P.D. Jones, 2012, Synoptic messages to extend climate data records, J. Geophys. Res., 117, D07101, doi:10.1029/2011JD016687

 Extremes

  • Worldwide trends in indices of extremes: Alexander, L.V., X. Zhang, T.C. Peterson, J. Caesar, B. Gleason, A.M.G. Klein Tank, M. Haylock, D. Collins, B. Trewin, F. Rahimzadeh, A. Tagipour, P. Ambenje, K. Rupa Kumar, J. Revadekar and G. Griffiths, 2006. Global observed changes in daily climate extremes of temperature and precipitation. J. Geophys. Res., 111, D05109, doi:10.1029/2005JD006290
  • Global dataset of temperature and precipitation extremes indices 1901-2010: Donat, M. G., L. V. Alexander, H. Yang, I. Durre, R. Vose, R. J. H. Dunn, K. M. Willett, E. Aguilar, M. Brunet, J. Caesar, B. Hewitson, C. Jack, A. M. G. Klein Tank, A. C. Kruger, J. Marengo, T. C. Peterson, M. Renom, C. Oria Rojas, M. Rusticucci, J. Salinger, A. S. Elrayah, S. S. Sekele, A. K. Srivastava, B. Trewin, C. Villarroel, L. A. Vincent, P. Zhai, X. Zhang and S. Kitching, 2013: Updated analyses of temperature and precipitation extreme indices since the beginning of the twentieth century: The HadEX2 dataset, J. Geophys. Res. Atmos., 118, 2098–2118, doi:10.1002/jgrd.50150
  • Temperature and precipitation extremes indices for climate monitoring 1951-present:  Donat, M. G., L. V. Alexander, H. Yang, I. Durre, R. Vose, J. Caesar, 2013: Global land-based datasets for monitoring climatic extremes, Bulletin of the American Meteorological Society, 94, 997-1006, doi:10.1175/BAMS-D-12-00109.1
  • Wind extremes: Brönnimann, S., O. Martius, H. von Waldow, C. Welker, J. Luterbacher, G.P. Compo, P.D. Sardeshmukh, and T. Usbeck, 2012: Extreme winds at northern mid-latitudes since 1871. Meteorol. Zeit., 21, 13-27, doi: 10.1127/0941-2948/2012/0337

​Synoptic Events:


  • Wind gusts thresholds for Meteoalarm: Stepek, A., I.L. Wijnant, G. van der Schrier, E.J.M. van den Besselaar, A.M.G. Klein Tank, 2012. Severe wind gust thresholds for Meteoalarm derived from uniform return periods in ECA&D. Nat. Hazards Earth Syst. Sci., 12, 1969-1981, doi:10.5194/nhess-12-1969-2012

 Trends

  • European precipitation extremes: van den Besselaar, E.J.M., A.M.G. Klein Tank, T.A. Buishand, 2012. Trends in European precipitation extremes over 1951-2010. Int. J. Climatol., doi:10.1002/joc.3619
  • E-OBS scaling paper: Hofstra, N., M. New, C. McSweeney, 2010. The influence of interpolation and station network density on the distributions and trends of climate variables in gridded daily data. Clym.Dyn., 35, 841, doi:10.1007/s00382-009-0698-1
  • Walker circulation:  L'Heureux, M.L., S. Lee, and B. Lyon, 2013. Recent multidecadal strengthening of the Walker circulation across the tropical Pacific.  Nature Clim Change, doi:10.1038/nclimate1840.


*This list is not comprehensive, but the interested reader should feel free to request an account and include any relevant published research the reader think may be useful to communicate. Please use the existing categories, only adding new ones as needed. Add a brief description and use reverse chronological order under each topic. Readers are encouraged to link a Discussion Page summarizing their paper, presentation, or other results.

Add new comment

CAPTCHA
This question is for testing whether or not you are a human visitor and to prevent automated spam submissions.

ICA&D: International Climate Assessment & Dataset

Created by eca on - Updated on 08/09/2016 11:36

The ICA&D (International Climate Assessment & Dataset) climate services concept successfully combines the work of WMO`s Expert Team on Climate Change Detection and Indices (ETCCDI) and WMO`s Data Rescue (DARE) activities. The concept builds on the sofware developed for the European Climate Assessment & Dataset (ECA&D), a webportal for daily station data and derived indices brought together under regional cooperation. ICA&D combines the climate monitoring and assessment activities developed in ECA&D with DARE activities. ICA&D is already applied in the four regions mentioned below.

ECA&D:

The European Climate Assessment & Dataset (ECA&D) is the result of a collaboration between meteorological institutes and universities throughout Europe and the Meditteranean area, WMO Region VI. One of the partners is the MEDARE initiative which coordinates DARE activities across the Greater Mediterranean Region.

SACA&D:

The Southeast Asian Climate Assessment & Dataset (SACA&D) is a result of the DiDaH (Digitisasi Data Historis) project, an ongoing cooperation in data digitization between the Indonesian national meteorological institute (BMKG) and KNMI. BMKG staff were trained by the ECA&D team to set-up the ICA&D system in Southeast Asia.

LACA&D:

The ICA&D system is currently under development in Latin America as the Climate Assessment & Dataset (LACA&D) in collaboration with CIIFEN. This actvity builds on a regional indices workshop held in Guayaquil (Ecuador) in January 2011.

WACA&D:

First steps are being taken to set-up the West African Climate Assessment & Dataset (WACA&D) in collaboration with ACMAD.


Add new comment

CAPTCHA
This question is for testing whether or not you are a human visitor and to prevent automated spam submissions.

ECA&D: European Climate Assessment & Dataset

Created by eca on - Updated on 08/09/2016 11:37

ECA&D:

The European Climate Assessment & Dataset (ECA&D) contains daily land station observations for >7500 stations throughout Europe and the Mediterranean. The data is provided by National Meteorological Services, Universities as well as by other data providers. Everyone with daily station observations can participate.

The available elements are:

  • Minimum temperature
  • Mean temperature
  • Maximum temperature
  • Precipitation amount
  • Sea level pressure
  • Snow depth
  • Relative humidity
  • Sunshine duration
  • Cloud cover
  • Wind speed
  • Maximum wind gust
  • Wind direction     

About half of the daily station series are available for download for non-commercial research projects and education. The ECA&D data policy gives more details about the use of the available data. Often, additional metadata is available, such as the surface coverage of the station, soil type or a picture of the observing site.

Basic quality control is performed on each of the series. The station series are then blended with those from nearby stations and the Global Telecommunication System (GTS) to create series that are as long as possible. These series are used to derive a large variety of indices of extremes, such as the number of wet days, number of frost days, but also more exotic indices like the growing season length, potential evapotranspiration and the universal thermal climate index. Time series plots as well as derived information, such as trends and anomalies, are available and shown on maps. Also homogeneity checks are done and climatologies are calculated.

E-OBS:

The blended station series are used to create the E-OBS gridded dataset which has a daily resolution. A three-step methodology of interpolating the daily data is used: interpolating the monthly mean using thin-plate splines to define the underlying spatial ‘‘trend’’ of the data; kriging the anomalies with regard to the monthly mean; and applying the interpolated anomaly to the interpolated monthly mean to create the final result. Files with daily standard errors and elevation are available too.

E-OBS is available for the period 1950-present. There are 4 different versions: 2 grid resolutions x 2 grid flavours. Data is made available on a 0.25 and 0.5 degree regular lat-lon grid, as well as on a 0.22 and 0.44 degree rotated pole grid, with the north pole at 39.25N, 162W. The dataset is available for 5 elements:

  • Minimum temperature
  • Mean temperature
  • Maximum temperature
  • Precipitation amount
  • Sea level pressure

References:

  • ATBD: Algorithm Theoretical Basis Document.
  • Klein Tank, A.M.G. and et al., 2002. Daily dataset of 20th-century surface air temperature and precipitation series for the European Climate Assessment. Int. J. Climatol., 22, 1441-1453, doi:10.1002/joc.773.
  • Klok, E.J. and A.M.G. Klein Tank, 2009. Updated and extended European dataset of daily climate observations. Int. J. Climatol., 29, 1182, doi:10.1002/joc.1779.
  • Haylock, M.R., N. Hofstra, A.M.G. Klein Tank, E.J. Klok, P.D. Jones, and M. New (2008), A European daily high-resolution gridded data set of surface temperature and precipitation for 1950-2006. J. Geophys. Res., 113, D20119, doi:10.1029/2008JD010201.
  • van den Besselaar, E.J.M., M.R. Haylock, G. van der Schrier, A.M.G. Klein Tank, 2011, A European Daily High-resolution Observational Gridded Data set of Sea Level Pressure, J. Geophys. Res., 116, D11110, doi:10.1029/2010JD015468

Add new comment

CAPTCHA
This question is for testing whether or not you are a human visitor and to prevent automated spam submissions.

An Intercomparison of Temperature Trends in the U.S. Historical Climatology Network and Recent Atmospheric Reanalyses

Created by Russell.Vose on - Updated on 07/18/2016 10:13

From: Vose, R. S., S. Applequist, M. J. Menne, C. N. Williams Jr., and P. Thorne. 2012: An intercomparison of temperature trends in the U.S. Historical Climatology Network and recent atmospheric reanalyses. Geophys. Res. Lett., 39, L10703, doi:10.1029/2012GL051387.

Temperature trends over 1979-2008 in the U.S. Historical Climatology Network (HCN) are compared with those in six recent atmospheric reanalyses.  For the conterminous United States, the trend in the adjusted HCN (0.327 °C dec-1) is generally comparable to the ensemble mean of the reanalyses (0.342 °C dec-1).  It is also well within the range of the reanalysis trend estimates (0.280 to 0.437 °C dec-1). The bias adjustments play a critical role, as the raw HCN dataset displays substantially less warming than all of the reanalyses.  HCN has slightly lower maximum and minimum temperature trends than those reanalyses with hourly temporal resolution, suggesting the HCN adjustments may not fully compensate for recent non-climatic artifacts at some stations.  Spatially, both the adjusted HCN and all of the reanalyses indicate widespread warming across the nation during the study period.  Overall, the adjusted HCN is in broad agreement with the suite of reanalyses.

Least-squares trends (°C dec-1) in mean annual temperature over the conterminous United States during the period 1979-2008.


Categorical depiction of grid-box trends in mean annual temperature during the period1979-2008.

Add new comment

CAPTCHA
This question is for testing whether or not you are a human visitor and to prevent automated spam submissions.

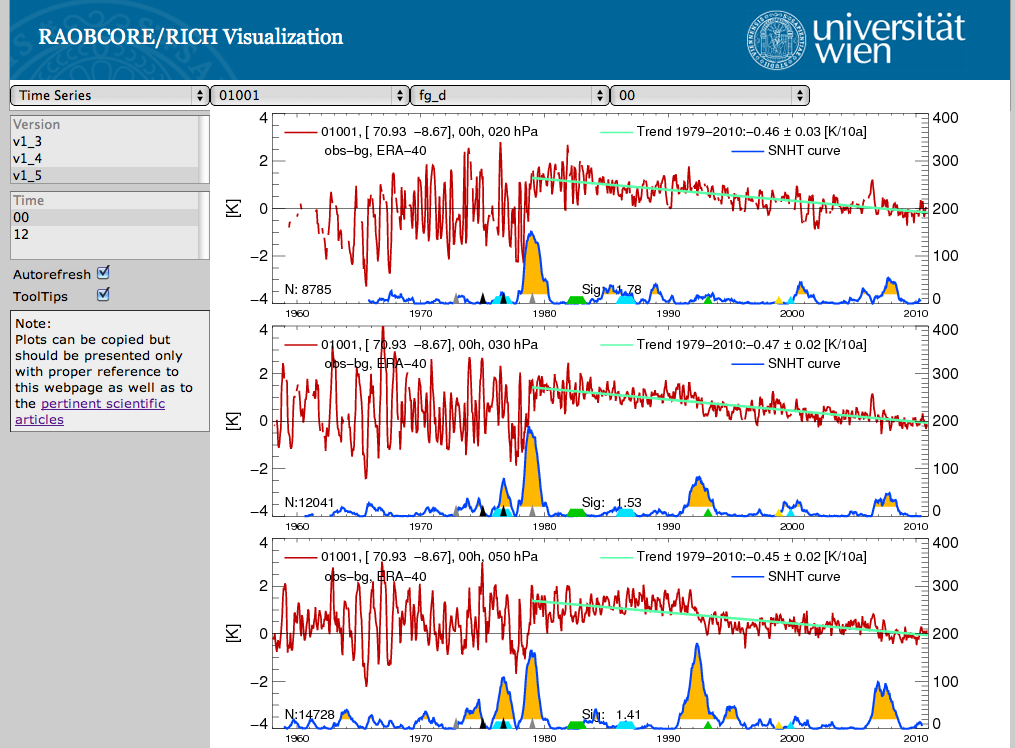
RAOBCORE/RICH Visualization

Created by lorenzo.ramell… on - Updated on 03/29/2021 09:27

RAOBCORE and RICH

online Viewers now available!


RAOBCORE => RAdiosone OBservation COrrection using REanalyses

RICH              => Radiosonde Innovation Composite Homogenization


New visualization utility for RAOBCORE and RICH adjusted global radiosonde dataset now available:

RAOBCORE/RICH

Version 1.5.1

RAOBCORE corrections 

http://srvx7.img.univie.ac.at/~leo/richvis/newindex.html 

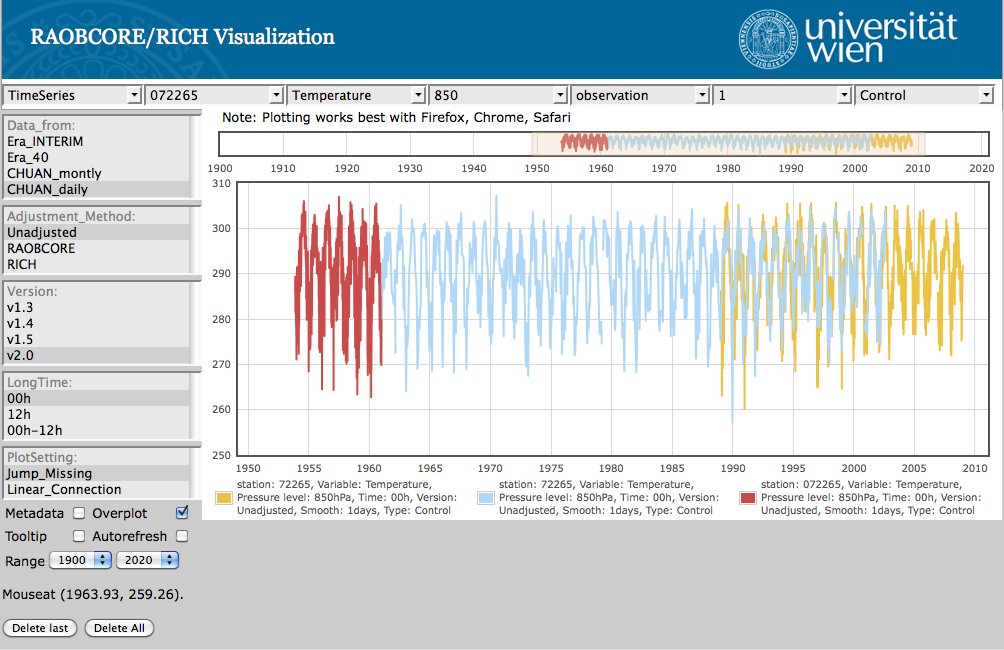
New visualization utility for RAOBCORE 2.0 global radiosonde dataset now available.

Adjustments are not yet provided.

RAOBCORE v2.0 Viewer 

http://srvx7.img.univie.ac.at/~lorenzo/DEVL_rrvis_2.0/html/

Notes: Viewer RAOBCORE 2.0

  • Station : WMO radiosonde station number (not all the stations ara available for all the archives)
  • Varibale;
  • Pressure level [hPa];
  • Type: observation, biascorrection (if available), FirstGuess departures (if available) and Analysis departures ( if available); 
  • Smooth: running mean over the time serie;
  • Experiment: only Control is available;
  • Data from: in this menu are shown all the possible soure of data we are using:
    • Stations_ERA_INTERIM: data from ERA_INTERIM (observations and departures);
    • Stations_ERA_40: data from ERA_40 (obseravtiona and departures);
    • Stations_CHUAN_montly: monthly data from the CHUAN archive (observations from CHUAN);
    • Stations_CHUAN_daily: daily data from the CHUAN archive (observation from CHUAN, Analysis departures from 20CR);
    • 20CR: recoverd (only in presence of observation) time series from the 20CR interpolated at the station latitude and longitude;
    • ERA_40: recoverd (only in presence of observation) time series from ERA_40 interpolated at the station latitude and longitude;
    • long_20CR: recoverd time series (covers all the 20CR length) from the 20CR interpolated at the station latitude and longitude;
    • MERGED_archive: it contains merged obseravtions data from ERA_INTERIM, ERA_40 and CHUAN; the analysis departures are from 20CR.
  • Adjustment_Method: only Unadjusted is now available;
  • Version: only v2.0 is available;
  • Long_Time: 
    • 00h: data at Midnight;
    • 12h: data at Noon;
    • 00h - 12h: difference between Midnight  and Noon;
  • PlotSetting:
    • Jump_Missing: if there is a missind value, nothing is plotted;
    • Linear_Connection: if there is a missing value, a linear connection between the last available and the new available will be plotted;
  • Metadata: shows (if available) the metadata for the selected station; 
  • Overplot: allows plotting many time series on the same frame;
  • Tooltip: gives hints about the different menus;
  • Autorefresh: at each selection it tries to plot the current setting;
  • Range: scaled for the time axis;
  • Delete Last: deletes the last plot form the frame;
  • Delete All : deletes all the plots from the frame;

In order to zoom in: select with a mouse and drag the area that you would like to inspect. It will be magnified in the main frame. 


Suggested stations for a easy start :

  • Temperature:

Station: 010393, Merged archive, pressure 1000 or 850 hPa -> long time series back to 1905

Station: 004018, Merged archive, pressure 850 hPa -> continue time serie back to 1946;


  • U and V Wind component:

Station: 016716, Merged archive, pressure 200 hPa, Type: Observations and Analysis depertures -> big shift (better visible with smooth bigger than 100);

  •  Wind Speed:

Station: 016716, Merged archive, pressure 200 hPa, Type: Observations and Analysis depertures -> big shift (better visible with smooth bigger than 100)  


Add new comment

CAPTCHA
This question is for testing whether or not you are a human visitor and to prevent automated spam submissions.

Surface data quality control issues

Created by gilbert.p.comp… on - Updated on 07/18/2016 10:13

Several issues arise with quality controlling (QC) station data.

In HadISD version 1, the UK Met Office Hadley Centre is using the following procedures to subset and QC the data:

[RJHD] I've added a one sentence description of the QC tests used in HadISD which were mostly outlined in the talk - just to jog memories.[/RJHD]

Prior to QC:

Duplicate Stations: full station repetition (i.e. that the data in one station ID is repeated under another station ID somewhere. For example,  if merging of stations for some reason didn't happen correctly.)

Internal Tests:

Duplicate Months: full month repetition within station

Frequent Value Check: Identify values on total dataset, flag on annual basis if still anomalous.

Gap Check: Flag months who's median is different to average, flag observations which are different to rest of population (both on calendar month basis)

Streak Check: streaks of the same value are flagged

Spike Check: spikes of up to three points are removed

Climatological Check: observations which are different to the climatology for each hour/month as calculated from the station are flagged.

Variance Check: months with differing within-station variance (high/low) to the rest of the record are flagged

Odd Clusters: short isolated clusters of data are flagged

Diurnal Cycle: periods with diurnal cycles apparently significantly offset to the rest of the series are flagged

Humidity Checks: excessively long periods of supersaturation and dew-point depression are removed.

Cloud Cover Logical Checks: logical consistency checks for Low, Mid, High and Total cloud amounts

External Tests:

Neighbour Check: up to 10 neighbours within 300km and 500m height are used to check if station values are reasonable.  Can also remove flags from certain tests.

Clean-Up: flag months with excessive numbers of flags or very few remaining observations.

Issues:

For these hourly and subdaily data, issues with these include:

  1. the 300 km radius may mingle stations that have different climates when performing a neighbor check.
    1. weigthing in favor of the nearest stations during the evaluations might be important
  2. surface pressure should be included as a processed variable to allow derivation of specific humidity from the dewpoint
  3. Coordinated and somewhat formalized feedback to NCDC should be considered
    1. e.g. when and how will NCDC use recommendations for station fixes uncovered by HadISD - users will eventually want to know this.
  4. When examining the dual valued curves, as shown in many of the QC examples, on should inspect to see that only one value is at each time interval, i.e. there are not duplicates at 0Z
  5. As much source data metadata, from NCDC ISD, should be carried forward in the netCDF metadata files, e.g.
    1. what ISDversion is the starting point for HADISD.
    2. station metadata (lat, lon, elev),
    3. software version,
    4. doi?
  6. Possibly detail inventories for flagging, step by step in the QC process, could be useful for examining systematic errors.  This could also be station by station and maintained online for user viewing.  A condensed version of this should be published - as is planned.
  7. Test if Gaussian a good fit, and try other distributions when trying to characterise the width of the population distribution
  8. Use wind direction and wind speed  together when doing QC
  9. If QC removes large sections of data after a clear break in the system, homogenisation checks won't find the now-removed break
  10. Provide metrics for flags and unflagging for final products.
  11. More than just 2 levels of flagging
  12. Use two missing data indicators, one for missing, one for flagged/removed


Add new comment

CAPTCHA
This question is for testing whether or not you are a human visitor and to prevent automated spam submissions.

ISPD Acknowledgments

Created by gilbert.p.comp… on - Updated on 07/18/2016 10:13

Work in progress

Digitization of Indian Monsoon data 1893-1899 are funded by the University of Giessen, Germany.

Feedback information in the ISPD comes from the 20th Century Reanalysis Project. The 20th Century Reanalysis Project used resources of the National Energy Research Scientific Computing Center and of the Oak Ridge Leadership Computing Facility at Oak Ridge National Laboratory, which are supported by the Office of Science of the U.S. Department of Energy under Contract No. DE-AC02-05CH11231 and Contract No. DE-AC05-00OR22725, respectively. Support for the 20th Century Reanalysis Project dataset is provided by the U.S. Department of Energy, Office of Science Innovative and Novel Computational Impact on Theory and Experiment (DOE INCITE) program, and Office of Biological and Environmental Research (BER), and by the National Oceanic and Atmospheric Administration Climate Program Office. Support for the compilation of the ISPD is provided by the National Oceanic and Atmospheric Administration Climate Program Office and SwissRe.


Add new comment

CAPTCHA
This question is for testing whether or not you are a human visitor and to prevent automated spam submissions.

Submitting station data for the ISPD

Created by gilbert.p.comp… on - Updated on 07/18/2016 10:13

Guidelines for station data submission to the International Surface Pressure Databank

To submit station observations, please contact Dr. Gil Compo of the University of Colorado Cooperative Institute for Research in Environmental Sciences  and NOAA Earth System Research Laboratory Physical Sciences Division using <compo@colorado.edu>.

Observations of pressure, either surface or sea level pressure from the time that they were taken, are welcome.

Please include essential metadata such as the time that the observation was taken and station latitude, longitude, and elevation.

Depending on the size of the files, observation data files can be emailed to NOAA's National Climatic Data Center to the dataset assembler Dr. Xungang Yin Xungang.Yin@noaa.gov.

Please submit the data to NOAA's National Climatic Data Center Xungang.Yin@noaa.gov using the ASCII exchange format v1.0. Other data formats can also be accepted. Please coordinate your format with Dr. Yin and Dr. Compo

Depending on the instrument, the pressure data should be corrected for gravity and temperature. The data do not need to be reduced to sea level. 

If you have temperature data of subdaily, daily-averaged, or monthly-averaged resolution, please consider submitting that to surfacetemperatures.org.

Add new comment

CAPTCHA
This question is for testing whether or not you are a human visitor and to prevent automated spam submissions.

International Surface Pressure Databank Contributing Organizations

Created by gilbert.p.comp… on - Updated on 10/07/2019 19:45

Back to ISPD homepage

  1. All-Russian Research Institute of Hydrometeorological Information World Data Center
  2. Atmospheric Circulation Reconstructions over the Earth (ACRE)
  3. Australian Bureau of Meteorology
  4. Australian Meteorological Association, Citizen Science team
  5. British Antarctic Survey
  6. China University of Geosciences
  7. China Meteorological Administration
  8. Cook Islands Meteorological Service
  9. Danish Meteorological Institute
  10. Deutscher Wetterdienst (DWD; German Weather Service)
  11. Environment Canada, Climate Research Division
  12. ETH Zurich, Switzerland
  13. European and North Atlantic Daily to Multidecadal Climate Variability (EMULATE)
  14. European Reanalysis and Observations for Monitoring (EURO4M)/The WMO MEditerranean DAta REscue Initiative (MEDARE)
  15. European Reanalysis of Global Climate Observations (ERA-CLIM)
  16. GCOS Atmospheric Observation and Ocean Observation Panels for Climate WG on Surface Pressure
  17. GCOS/WCRP Working Group on Observational Data Sets for Reanalysis
  18. Hong Kong Observatory
  19. Icelandic Meteorological Office (IMO)
  20. International Best Track Archive for Climate Stewardship (IBTrACS)
  21. International Comprehensive Ocean–Atmosphere Data Set (ICOADS)
  22. International Environmental Data Rescue Organization (IEDRO)
  23. Japan Agency for Marine-Earth Science and Technology (JAMSTEC)
  24. Japan Meteorological Agency
  25. Jersey Met Department
  26. Koninklijk Nederlands Meteorologisch Instituut (KNMI; Royal Netherlands Meteorological Institute)
  27. Lamont-Doherty Earth Observatory of Columbia University
  28. McGill University, Canada
  29. Met Office Hadley Centre, UK
  30. MetéoFrance
  31. MeteoFrance—Division of Climate
  32. Meteorological and Hydrological Service, Croatia
  33. National Center for Atmospheric Research (NCAR), USA
  34. National Climate Center, Beijing, China
  35. National Institute for Water and Atmospheric Research (NIWA), New Zealand
  36. Nicolaus Copernicus University—Department of Meteorology and Climatology, Poland
  37. Niue Meteorological Service
  38. NOAA Climate Database Modernization Program (CDMP), USA
  39. NOAA Earth System Research Laboratory (ESRL) Physical Sciences Division, USA
  40. NOAA Midwest Regional Climate Center at UIUC, USA
  41. NOAA National Centers for Environmental Prediction (NCEP), USA
  42. NOAA National Centers for Environmental Information (NCEI), USA
  43. NOAA Northeast Regional Climate Center at Cornell Univ., USA
  44. NOAA Pacific Marine Environmental Laboratory, USA
  45. Norwegian Meteorological Institute
  46. Ohio State Univ.—Byrd Polar Research Center, USA
  47. Oldweather.org
  48. Portguese Institute of Sea and Atmosphere (IPMA), Portugal
  49. Proudman Oceanographic Laboratory, UK
  50. Signatures of environmental change in the observations of the Geophysical Institutes (SIGN)
  51. South African Weather Service
  52. South Eastern Australian Recent Climate History (SEARCH) project, The University of Melbourne
  53. Tanzania Meteorological Agency
  54. Univ. of Aberdeen, Scotland, UK
  55. Univ. of Bern, Switzerland
  56. Univ. of ColoradoCooperative Institute for Research in Environmental Sciences (CIRES)
  57. Univ. of East Anglia—Climatic Research Unit, UK
  58. Univ. of GiessenDepartment of Geography, Germany
  59. Univ. of Lisbon—Instituto Dom Luiz, Portugal
  60. Univ. of Milan—Department of Physics, Italy
  61. Univ. of Porto-Instituto Geofisico, Portugal
  62. Univ. Rovira i Virgili—Center for Climate Change (C3), Spain
  63. Univ. of South Carolina, USA
  64. Univ. of Toronto-Department of Physics, Canada
  65. Univ. of Washington, USA
  66. Weather Detective citizen science project
  67. WeatherRescue.org
  68. World Meteorological Organization-Mediterranean Climate Data Rescue (MEDARE)
  69. ZentralAnstalt für Meteorologie und Geodynamik (ZAMG; Austrian Weather Service)

Back to ISPD homepage

Add new comment

CAPTCHA
This question is for testing whether or not you are a human visitor and to prevent automated spam submissions.

The International Surface Pressure Databank

Created by tcram on - Updated on 06/25/2024 14:24

The International Surface Pressure Databank

 
Created by tcram on Thu, 05/19/2011 - 16:31 - Updated on 07/24/2020 11:16

The International Surface Pressure Databank (ISPD, Cram et al. 2015) is the world's largest collection of pressure observations. It spans 1722-2015. It has been developed by extracting observations from established international archives of meteorological variables and by combining these with observations made available through additional international cooperation with data recovery facilitated by the Atmospheric Circulation Reconstructions over the Earth (ACRE) Initiative and the other contributing organizations. The ISPD is assembled under the auspices of the GCOS Working Group on Surface Pressure and the GCOS/WCRP Working Group on Observational Data Sets for Reanalysis by NOAA Earth System Research Laboratory (ESRL), NOAA's National Centers for Environmental Information (NCEI), and the University of Colorado's Cooperative Institute for Research in Environmental Sciences (CIRES).  

The ISPD consists of three components: station observations, marine observations, and tropical cyclone best track pressure reports.

The station component is a blend of many national and international collections, with the largest contributor being surface and sea level pressure observations from the International Surface Database (ISD, Lott et al., 2008). Procedures for blending the station component are described at Yin et al. (2008).

The marine component consists of the available version of the International Comprehensive Ocean Atmosphere Data Set (ICOADS, Worley et al., 2005). In some ISPD versions, ICOADS Auxiliary data, ACRE recovered expeditions, and Oldweather.org data are also used.

The tropical cyclone component comes mainly from the available version of the International Best Track Archive for Climate Stewardship (IBTrACS, Knapp et al., 2010). In the absence of a central pressure estimate, IBTrACS wind estimates are converted to pressure using an empirical gradient wind equation (Compo et al. 2011).


To submit station observations, please submit your observations to NOAA's National Center for Environmental Information via Xungang.Yin@noaa.gov using the ASCII exchange format v1.0.

Version 5 (1755-2012)

Version 5 of the International Surface Pressure Databank is currently being assembled. 
 

Additional guidelines for station data submission are under development.

Version 4 (1836-2015)

Version 4 of the ISPD is available courtesy of the Research Data Archive of the Computational and Information Systems Laboratory (CISL) at the National Center for Atmospheric Research (NCAR) from http://rda.ucar.edu/datasets/ds132.2/. Subsetting tools are available to retrieve the data in ASCII format. Documentation for the HDF5 format is provided at https://rda.ucar.edu/datasets/ds132.2/index.html#!docs.  Users can also browse an interactive map displaying observation locations by type, date, and region using the NCAR Interactive Station Viewer at https://rda.ucar.edu/datasets/ds132.2/index.html#wstationViewer.

NOAA's National Centers for Environmental Information has merged the station component using the ASCII exchange format v1.1.  The marine component comes from ICOADS version 3+, with enhancements to ICOADS version 3 from ACRE, Oldweather.org and Weather Detective courtesy of P. Brohan of the UK Met Office. The tropical cyclone component comes mainly from IBTrACS V03r10. See Slivinski et al. 2019 for details.

Maps showing the location of stations in a selected year can be browsed at https://psl.noaa.gov/data/ISPD/.

Maps showing the location of observations used in 20CRV3 in a selected year can be browsed at https://psl.noaa.gov/data/20CRv3_ISPD_obscounts/

Maps showing the location of all available, rejected, and assimilated observations used in 20CRV3 in a selected month can be browsed at https://psl.noaa.gov/data/20CRv3_ISPD_obscounts_bymonth/

The V4 list of stations, including location and period of coverage, and their history is a text file that can be imported into Excel or read into other programs using this format.

DOI: 10.5065/9EYR-TY90

Citation: Compo, G. P., et al. 2019. The International Surface Pressure Databank version 4. Research Data Archive at the National Center for Atmospheric Research, Computational and Information Systems Laboratory. https://doi.org/10.5065/9eyr-ty90. Accessed § dd mmm yyyy.
  §Please fill in the "Accessed" date with the day, month, and year (e.g. - 5 Aug 2011) you last accessed the data from the NCAR Research Data Archive.


Version 3 (1755-2011)

Version 3 of the ISPD is available courtesy of the Research Data Archive of the Computational and Information Systems Laboratory (CISL) at the National Center for Atmospheric Research (NCAR) from http://rda.ucar.edu/datasets/ds132.1/. NCAR also has documentation on the HDF5 Format for International Surface Pressure Data Bank v10.11.

NOAA's National Climatic Data Center has merged the station component using the ASCII exchange format v1.1.  The marine component comes from ICOADS version 2.5. The tropical cyclone component comes from IBTrACS V03r03. ISPDv3 is being used in the century long reanalysis ERA-20C generated by ERA-CLIM,  by the century long reanalysis being generated by JMA/MRI, and by NOAA/CIRES in 20CR version 2c.

Maps showing the location of stations in a selected year can be browsed at http://www.esrl.noaa.gov/psd/data/ISPD/v3.0/
The V3 list of stations, including location and period of coverage, and their history is a text file that can be imported into Excel or read into other programs using this format.

DOI: 10.5065/D6D50K29

Citation: Compo, G. P., et al. 2015. The International Surface Pressure Databank version 3. Research Data Archive at the National Center for Atmospheric Research, Computational and Information Systems Laboratory. http://dx.doi.org/10.5065/D6D50K29. Accessed § dd mmm yyyy.
  §Please fill in the "Accessed" date with the day, month, and year (e.g. - 5 Aug 2011) you last accessed the data from the NCAR Research Data Archive.


Version 2 (1768-2012)

Version 2 of the ISPD can be obtained courtesy of Data Engineering and Curation Section of the Computational and Information Systems Laboratory at the National Center for Atmospheric Research from http://rda.ucar.edu/datasets/ds132.0/. NCAR also has documentation on the HDF5 Format for International Surface Pressure Data Bank v10.11.

For the period 1871-2011, Version 2 includes metadata information from the quality control system of the 20th Century Reanalysis Project. These so-called "feedback" records include the difference between the final analysis and each observation, the estimated uncertainty in the observation, and other quality information.

See Compo et al. (2011) and Cram et al. (2015) for a more detailed description. 

Maps showing the location of stations in a selected year can be browsed at http://www.esrl.noaa.gov/psd/data/ISPD/v2.0/.
The V2 list of stations, including location and period of coverage, and their history is a text file that can be imported into Excel or read into other programs using this format.

DOI:10.5065/D6SQ8XDW

Citation: Compo, G. P., et al. 2010. International Surface Pressure Databank (ISPDv2). Research Data Archive at the National Center for Atmospheric Research, Computational and Information Systems Laboratory. http://dx.doi.org/10.5065/D6SQ8XDW. Accessed§ dd mmm yyyy.
  §Please fill in the "Accessed" date with the day, month, and year (e.g. - 5 Aug 2011) you last accessed the data from the NCAR Research Data Archive.

      Future Additions

         At http://badc.nerc.ac.uk/browse/badc/corral/images/metobs there any many useful links to information about known observations and their recovery status. The site has links to scanned images of hard copy meteorological observations held by the National Meteorological Archive of the UK Met Office that have been imaged to date. It also has an EXCEL file containing the status of all of the historical weather data (whether hard copy, scanned or digitised) being recovered, imaged, and digitised by the international ACRE community and international organisations projects and researchers linked to the Initiative for the ISPD. Additionally, the site has annual global maps showing terrestrial weather data distribution and their status.

Guidelines for station data submission

Data Access

The International Surface Pressure Databank would like to thank the contributing organizations and make many grateful acknowledgments. Support for the compilation of the ISPD is provided by the National Oceanic and Atmospheric Administration Climate Program Office and SwissRe.

The 20th Century Reanalysis Project used resources of the National Energy Research Scientific Computing Center and of the Oak Ridge Leadership Computing Facility at Oak Ridge National Laboratory, which are supported by the Office of Science of the U.S. Department of Energy under Contract No. DE-AC02-05CH11231 and Contract No. DE-AC05-00OR22725, respectively. Support for the 20th Century Reanalysis Project dataset is provided by the U.S. Department of Energy, Office of Science Innovative and Novel Computational Impact on Theory and Experiment (DOE INCITE) program, and Office of Biological and Environmental Research (BER), by the National Oceanic and Atmospheric Administration Climate Program Office, and by NOAA Earth System Research Laboratory Physical Sciences Division.

References:

Compo, G.P., J.S. Whitaker, P.D. Sardeshmukh, N. Matsui, R.J. Allan, X. Yin, B.E. Gleason, R.S. Vose, G. Rutledge, P. Bessemoulin, S. Brönnimann, M. Brunet, R.I. Crouthamel, A.N. Grant, P.Y. Groisman, P.D. Jones, M. Kruk, A.C. Kruger, G.J. Marshall, M. Maugeri, H.Y. Mok, Ø. Nordli, T.F. Ross, R.M. Trigo, X.L. Wang, S.D. Woodruff, and S.J. Worley, 2011: The Twentieth Century Reanalysis Project. Quarterly J. Roy. Meteorol. Soc., 137, 1-28. DOI: 10.1002/qj.776.

Cram, T.A., G. P. Compo, X. Yin, R. J. Allan, C. McColl, R. S. Vose, J.S. Whitaker, N. Matsui, L. Ashcroft, R. Auchmann, P. Bessemoulin, T. Brandsma, P. Brohan, M. Brunet, J. Comeaux, R. Crouthamel, B. E. Gleason, Jr., P. Y. Groisman, H. Hersbach, P. D. Jones, T. Jonsson, S. Jourdain, G. Kelly, K. R. Knapp, A. Kruger, H. Kubota, G. Lentini, A. Lorrey, N. Lott, S. J. Lubker, J. Luterbacher, G. J. Marshall, M. Maugeri, C. J. Mock, H. Y. Mok, O. Nordli, M. J. Rodwell, T. F. Ross, D. Schuster, L. Srnec, M. A. Valente, Z. Vizi, X. L. Wang, N. Westcott, J. S. Woollen, S. J. Worley, 2015: The International Surface Pressure Databank version 2. Geoscience Data Journal, 2, 31-46. DOI: 10.1002/gdj3.25.

Knapp KR, Kruk MC, Levinson DH, Diamond HJ, Neumann CJ, 2010: The International Best Track Archive for Climate Stewardship (IBTrACS): Unifying tropical cyclone best track data. Bull. Amer. Meteorol. Soc.91: 363376. DOI: 10.1175/2009BAMS2755.1.

Lott N, Vose R, Del Greco SA, Ross TF, Worley S, Comeaux J. 2008. ‘The Integrated Surface Database: Partnerships and progress.’ In Proceedings of 88th AMS Annual Meeting, 20–25 January 2008, New Orleans, Louisiana, combined preprints (CD-ROM), Amer. Meteorol. Soc: Boston, MA. Available from http://www1.ncdc.noaa.gov/pub/data/ish/ams-isd-jan08.pdf.

McColl, C., X. Yin, G. Compo, R. Allan, R. Vose, S. Woodruff, K. Knapp, and T. Cram, 2011: Assembling the International Surface Pressure Databank. World Climate Resarch Programme Open Science Conference, Denver, USA, 24 October. Poster link.

Slivinski, L. C., Compo, G. P., Whitaker, J. S., Sardeshmukh, P. D., Giese, B. S., McColl, C., Allan, R., Yin, X., Vose, R., Titchner, H., Kennedy, J., Spencer, L. J., Ashcroft, L., Brönnimann, S., Brunet, M., Camuffo, D., Cornes, R., Cram, T. A., Crouthamel, R., Domínguez‐Castro, F., Freeman, J. E., Gergis, J., Hawkins, E., Jones, P. D., Jourdain, S., Kaplan, A., Kubota, H., Le Blancq, F., Lee, T., Lorrey, A., Luterbacher, J., Maugeri, M., Mock, C. J., Moore, G. K., Przybylak, R., Pudmenzky, C., Reason, C., Slonosky, V. C., Smith, C., Tinz, B., Trewin, B., Valente, M. A., Wang, X. L., Wilkinson, C., Wood, K. and Wyszyński, P. (2019), Towards a more reliable historical reanalysis: Improvements for version 3 of the Twentieth Century Reanalysis system. Q J R Meteorol Soc. (accepted) doi:10.1002/qj.3598.

Worley SJ, Woodruff SD, Reynolds RW, Lubker SJ, Lott N. 2005. ICOADS release 2.1 data and products. Int. J. Climatol.25: 823842. DOI: 10.1002/joc.1166.

Yin X, Gleason BE, Compo GP, Matsui N, Vose RS, 2008: The International Surface Pressure Databank (ISPD) land component version 2.2.  National Climatic Data Center, Asheville, NC. Available from ftp://ftp.ncdc.noaa.gov/pub/data/ispd/doc/ISPD2_2.pdf or from this site.

Yvan Dutil (not verified)

Sat, 08/30/2014 - 10:15

Checking the map of the V4, the deepest in time we could expect to do a decent continuous North Atlantic Climate reanalysis using ISPD alone would be 1828. At this moment 1800, seams to be a hard limit to do any reanalysis at all for Europe. Unfortunately, they appears to be very little weather data available before 1850 not yet uncovered that could significantly improve this situation. I assume the 20CR version 2C is using a database close to the version 4. In consequence, the 1871 spatial coverage will be significantly extended compared to version 2. For 1850, the reanalysis will be comparable to the reanalysis for 1871 of the version 2.

Dear Yvan, As presented at the recent ACRE workshop in Toronto (proceedings will be online soon), the 20CRv2c currently being generated is using ISPDv3 not version 4, which is still being merged. You can access annual maps of the version 3 station component at http://www.esrl.noaa.gov/psd/data/ISPD/ . Note that these are not quite the version 3.2.9 that 20CRv2c is using, which has additional coverage over New Zealand, for example. Even so, the 1871 coverage is a substantial improvement over ISPDv2 used in 20CRv2. As to coverage before 1828, our ACRE colleagues continue to uncover new sources, so I would not rule out additional stations being digitized for that period.

Thank's for the prompt answer. Actually, I did notice that ISPDv4 map did not match with Phil Brohan visualisation of 20CR version 2C, after posting my comment. I did also notice that many potential sites on the ISPD 2.2.4 map are not yet included in the version 4. I assume the 20CR version 3 will be able to use version 4 or better.

Yvan, Correct. We expect 20CRv3 to use ISPDv4 or later. Similarly, ISPDv4 will be available to ECMWF's CERA-20C, a coupled centential reanalysis, as well as to the JMA SOUSEI project, which is also undertaking a coupled centennial reanalysis. Both of these were also presented at the ACRE 7th workshop. best wishes,

Yvan Dutil (not verified)

Thu, 01/23/2014 - 12:58

Hi, When browsing the ISPD station map (http://www1.ncdc.noaa.gov/pub/data/ispd/add-station/v3.0/), I found a large gap in data between 1755 and 1767. I am under the impression that this is artifact and that data exist, but are not presented on these maps. Does I am right?

Xiaoxiao (not verified)

Fri, 11/22/2013 - 02:13

Dear Dr. Compo, Thank you for your time of explaining for me. I'd like to consult you on some terminology.In your paper"The Twentieth Century Reanalysis Project", a minimum-error estimate of the 'true state' can be represented by the analysis ensemble mean(x¬a), page 6,in the bottom left corner,the paper also mentioned "the ensemble-mean analysis"(Hx¬a), page 8,in the bottom right corner. In the file Description of column data in ASCII format there is a variable ——"Ensemble mean analysis pressure". What are the differences between the analysis ensemble mean(x¬a),the ensemble-mean analysis(Hx¬a) and "Ensemble mean analysis pressure"? Thank you again for your time on this matter. Xiaoxiao

Dear Xiaoxiao, "H" is the operator which interpolates the analysis vector to the observation time and location. In this case, it is interpolating pressure from the model grid to the observation location and time. The xa you are referring to is the mean of 56 fields or vectors. Hxa is the mean of 56 scalars. Please let me know if I can clarify further. best wishes, gil

Dear Xiaoxiao, If you are interested, the individual members of the analysis fields from 20CR can be obtained at portal.nersc.gov The individual ensemble mean values of Hxa can be obtained from NCAR in the ISPD v2 http://rda.ucar.edu/datasets/ds132.0/ either in text files (see documentation http://rda.ucar.edu/datasets/ds132.0/docs/h5ftotxt.pdf ) or in HDF5 files (see documentation http://rda.ucar.edu/datasets/ds132.0/docs/International_Surface_Pressure_Data_Bank_format_v10.11.pdf) Please reply if you need any further assistance. best wishes, gil

Anonymous (not verified)

Sat, 11/16/2013 - 01:06

TYPE 183 and TYPE 180 : relative to mean sea level TYPE 181:"Observed Sea Level Press" is corrected and “Observed Surface Pressure” is not corrected . So, the 3 types are all relative to mean sea level except “Observed Surface Pressure” in type 181 . Am I right ? Many thanks.

Dear Anonymous, Yes, you are correct. TYPE 183 and TYPE 180 : relative to mean sea level TYPE 181:"Observed Sea Level Press" is corrected and “Observed Surface Pressure” is not corrected . So, the 3 types are all relative to mean sea level except “Observed Surface Pressure” in type 181 . May I suggest obtaining a login at this site? You can post comments with usually faster responses this way. Please let us know if we can be more help. best wishes, gil compo

Chesley.McColl

Fri, 11/15/2013 - 15:41

Dear Xiaoxiao,

The H5ftotxt is outputting the Observed Pressure, you are correct that the NCEP Type will tell you if this is Sea Level Pressure (ship observations) or Surface Pressure (station observations).

The pressure reported is not corrected to mean sea level, so it truly is surface pressure, at its reported elevation. Great questions. Respectfully yours, Chesley McColl
~

Anonymous (not verified)

Fri, 11/15/2013 - 11:16

Dear professor, May I ask two questions ? On this page:http://rda.ucar.edu/datasets/ds132.0/index.html?hash=!access#!docs I found two documentations ("h5ftotxt.doc "and" International_Surface_Pressure_Data_Bank_format_v10.11.doc") contained the following information: h5ftotxt.doc(for ASCII format ): Observed Pressure Float 8 8.2F International_Surface_Pressure_Data_Bank_format_v10.11.doc(for HDF-5 format): 1. Observed Sea Level Pressure The atmospheric sea level pressure observation (hectopascals) 4. Observed Surface Pressure The atmospheric surface pressure observation at the indicated elevation (hectopascals) Elevation The elevation of a geophysical point observation relative to Mean Sea Level (meters) My first question is : Are "Observed Sea Level Pressure" and "Observed Surface Pressure" mentioned in the second file for HDF-5 format both included in the “Observed Pressure” mentioned in the first file for ASCII format, which can be distinguished according to the NCEP Type ? The second question is : The "Observed Surface Pressure" mentioned in the second file for HDF-5 format means "the atmospheric surface pressure observation at the indicated elevation",dose this suggests that the observed surface pressure data have been normalised to sea level (these data have been reduced to sea level) since the Elevation is relative to Mean Sea Level ? Thank you for your kind consideration of the questions. It would be much appreciated if you can reply me about this. Best wishes! Sincerely yours, Xiaoxiao Zhang

Dear Xiaoxiao, Note that if you are seeing an NCEP type code of 183, this is a _station_ for which the ISPD only has a sea level pressure report. In no case is the column for Observed Surface Pressure reduced to sea level. It will be missing for stations that are of type 183. For stations of type 181, you may get both the Observed Surface Pressure and the Observed Sea Level Pressure. In the ASCII file you are referring to, when a station has reported both surface and sea level pressure, it will coded as type 181 and both reports will be included. Please let us know of any additional question. best wishes, gil compo

gilbert.p.comp…

Mon, 05/20/2013 - 10:14

Dear Asia, There are many such sites. It depends on what you mean by "latest surface and upper air chart". Numerical Weather Prediction combines the available observations ("actual data") with a short term forecast to form the so-called "analysis". One site with such products is the NOAA Earth System Research Laboratory Physical Sciences Division Map Room http://www.esrl.noaa.gov/psd/map/ . See, e.g., the Current Weather page at http://www.esrl.noaa.gov/psd/map/wx/current.shtml Many products target a particular region. What is your region of interest? The Unisys Weather Page has many useful maps for the United States http://www.weather.unisys.com/index.php ECMWF has many useful maps. See http://www.ecmwf.int/products/forecasts/d/charts. In general, this is a site for constructing analyses in retrospect, or "reanalysis". Please let me know if I can be of more help. best wishes, gil compo

gilbert.p.comp…

Mon, 03/18/2013 - 10:02

Dear Michel,

What you are seeing is the result of having used a T62 resolution spectral model to represent the orography of the earth in the 20th Century Reanalysis.

The pressure observations were adjusted to be consistent with the surface elevation of the assimilating NCEP model. Because of the long time period and many ensemble members, the resolution of the model was lower than one would prefer. This resolution is about 2degrees latitude by 2degree longitude. The spectral transformation will produce elevations in some reasons that have the sort of difference you are seeing from the true elevation.

Please see Compo et al. 2011 http://dx.doi.org/10.1002/qj.776 Section 3 equations 5-7. Also, you may be interested in Appendix B on the quality control system.

Note that the ISPD record preserves the original elevation and value (or values if both station and sea level pressure were reported), as well as providing the value as modified to be consistent with the assimilating model's orography.

Please let me know if I can be of more assistance.

best wishes,
gil compo

Michel Aïdonidis (not verified)

Mon, 03/18/2013 - 03:59

Bonjour, Using data from your ISPD, I saw that, for some observed Pressures, the gap between the observation and the modified value can sometimes be huge. For example, one can read that an observation for the station of Biarritz, along the Atlantic sea shore, Souwestern France, for which elevation = 0m, Pobs = 1009.0hPa and the modified one = 947.0hPa with an error of 1.6hPa. But, at the end of the line, the modified elevation is then 531m. How could one explain these different values and such important discrepancies? Many thanks, Michel

gilbert.p.comp…

Thu, 08/09/2012 - 10:43

Dear Xavier,

I'm glad you are finding the 20th Century Reanalysis project (20CR) data useful. Thank you for the kind words.

I apologize for the confusion on what was assimilated. No wind data were ever assimilated from any platform. Only pressure data were assimilated.

The web page you mention
http://www.esrl.noaa.gov/psd/data/ISPD/v2.0/
is showing only locations of the station component of the ISPDv2: these station pressure or sea level pressure from stations were available for assimilation. It does not refer to the ships used (the marine component of ISPD) in any way. I apologize for the confusion.

ISPD version 2 described above was used in 20CR.

You can access all of observations used in 20CR, including the specific ICOADS ship pressure observations and their associated feedback information, from
http://rda.ucar.edu/datasets/ds132.0/

From the Compo et al (2011) http://dx.doi.org/10.1002/qj.776 paper Section 4 page 7 describes the precise data that were used, including the specific ICOADS version numbers as a function of year.

Please let me know if I can be of more help.

best wishes,

gil

Xavier Bertin (not verified)

Thu, 08/09/2012 - 05:58

Dear Dr. Compo, I'm a French researcher working at CNRS in La Rochelle University in the field of coastal oceanography. I'm presently using the 20CR reanalysis to investigate long-term variability of wind-waves and storm surges. My preliminary results are are very promising and by the way, I would like to congratulate you and thank you for the outstanding work that you did with your team. In order to evaluate the time evolution of the acuracy of SLP and winds, I've planned to make a comparison between 20CR and data derived from Vonluntary Observing Ships taken from the ICOADS. Nevertheless, I was not able to understand from your 2011 paper if this data was assimilated in the 20CR reanalysis. Based on this webpage: http://www.esrl.noaa.gov/psd/data/ISPD/v2.0/ I would conclude that it is not the case but I would be very grateful if you could confirm me. Thank you by advance and best regards, Xavier Bertin

As mentioned above,

Version 2 of the ISPD can be obtained courtesy of Data Support Section of the Computational and Information Systems Laboratory at the National Center for Atmospheric Research from http://rda.ucar.edu/datasets/ds132.0/

To make a clearer, a link has been added for
Data Access

Thanks for the question.

Anonymous (not verified)

Mon, 02/06/2012 - 13:42

Dear David, This is curious, I would like to look into it further. But, first, from the HURDAT site http://www.aoml.noaa.gov/hrd/hurdat/easyread-2012.html , I only see 2 storms during the 10-14 September period, not three: Storm NOT NAMED is number 4 of the year 1928 Storm NOT NAMED is number 5 of the year 1928 Would you indicate what is the third system you are thinking of? Perhaps the third did not make it into HURDAT? Thanks in advance, Gil Compo

David Roth (not verified)

Sat, 02/04/2012 - 21:19

I have a question. I just ran across this link, which explains why some storms (particularly the historic ones landfall-wise) within Atlantic HURDAT seem to be depicted with the correct strength within the 20th century reanalysis pressure maps. The question is, if IBTrACS is used, which contains the Atlantic HURDAT, then why do some tropical storms and hurricanes appear to be missing? In particular, during the September 10-14, 1928 time frame, there are 3 tropical cyclones in existence between Florida, Bermuda, and the West Indes. However, the only tropical cyclone which appears on the pressure maps is the Great Miami Hurricane, which hit Florida on September 18. Why would two of the TCs not show up, when they showed up well in conventional data in real-time as well as HURDAT? See the October 1926 Monthly Weather Review article around page 411 for the conventional maps of the pressure pattern. Curious.

Add new comment

CAPTCHA
This question is for testing whether or not you are a human visitor and to prevent automated spam submissions.