Atmosphere

jra-references

Created by Cathy.Smith@noaa.gov on - Updated on 07/18/2016 10:13

JRA-55 Reference List

Kobayashi, S., Y. Ota, Y. Harada, A. Ebita, M. Moriya, H. Onoda, K. Onogi, H. Kamahori, C. Kobayashi, H. Endo, K. Miyaoka, and K. Takahashi , 2015: The JRA-55 Reanalysis: General Specifications and Basic Characteristics. J. Meteorol. Soc. Japan, 93, 5-48, doi: 10.2151/jmsj.2015-001.

Harada, Y., H. Kamahori, C. Kobayashi, H. Endo, S. Kobayashi, Y. Ota, H.Onoda, K. Onogi, K. Miyaoka, and K. Takahashi, 2016: The JRA-55 Reanalysis: Representation of atmospheric circulation and climate variability. J. Meteor. Soc. Japan, 94, doi:10.2151/jmsj.2016-015.

Kobayashi, C., and T. Iwasaki, 2016: Brewer-Dobson circulation diagnosed from JRA-55.  J. Geophys. Res., doi: 10.1002/2015JD023476.

JRA-55C Reference List

Kobayashi, C., H. Endo, Y. Ota, S. Kobayashi, H. Onoda, Y. Harada, K. Onogi and H. Kamahori, 2014: Preliminary results of the JRA-55C, an atmospheric reanalysis assimilating conventional observations only. Sci. Online Lett. on the Atmos., 10, 78-82. doi: 10.2151/sola.2014-016.

-----------------------------------------

JRA-25 Reference

Onogi, K., J. Tsutsui, H. Koide, M. Sakamoto, S. Kobayashi, H. Hatsushika, T. Matsumoto, N. Yamazaki, H. Kamahori, K. Takahashi, S. Kadokura, K. Wada, K. Kato, R. Oyama, T. Ose, N. Mannoji and R. Taira, 2007 : The JRA-25 Reanalysis. J. Meteor. Soc. Japan, 85, 369-432.


Simon Chabrillat (not verified)

Mon, 07/06/2015 - 17:46

This new reference for Kobayashi et al. (2015) is not complete: the journal name (J. Meteorol. Soc. Japan) is missing

Ebita, A., S. Kobayashi, Y. Ota, M. Moriya, R. Kumabe, K. Onogi, Y. Harada, S. Yasui, K. Miyaoka, K. Takahashi, H. Kamahori, C. Kobayashi, H. Endo, M. Soma, Y. Oikawa, and T. Ishimizu, 2011: The Japanese 55-year Reanalysis "JRA-55": an interim report, SOLA, 7, 149-152.
(This article is an interim report of JRA-55 as of 2011. A comprehensive report of JRA-55 is under preparation to be submitted to J. Meteor. Soc. Japan (as of October 2013).)

Ebita, A., S. Kobayashi, Y. Ota, M. Moriya, R. Kumabe, K. Onogi, Y. Harada, S. Yasui, K. Miyaoka, K. Takahashi, H. Kamahori, C. Kobayashi, H. Endo, M. Soma, Y. Oikawa, and T. Ishimizu, 2011: The Japanese 55-year Reanalysis "JRA-55": an interim report, SOLA, 7, 149-152.
(Note: This article is an interim report of JRA-55 as of 2011. A comprehensive report of JRA-55 is under preparation to be submitted to J. Meteor. Soc. Japan (as of November 2013).)
Add new comment

CAPTCHA
This question is for testing whether or not you are a human visitor and to prevent automated spam submissions.

US Summer Regional Climate Variability

Created by michael.bosilovich on - Updated on 07/18/2016 10:13

From: Bosilovich, Michael G., 2013: Regional Climate and Variability of NASA MERRA and Recent Reanalyses: U.S. Summertime Precipitation and Temperature. J. Appl. Meteor. Climatol., 52, 1939–1951. doi: http://dx.doi.org/10.1175/JAMC-D-12-0291.1

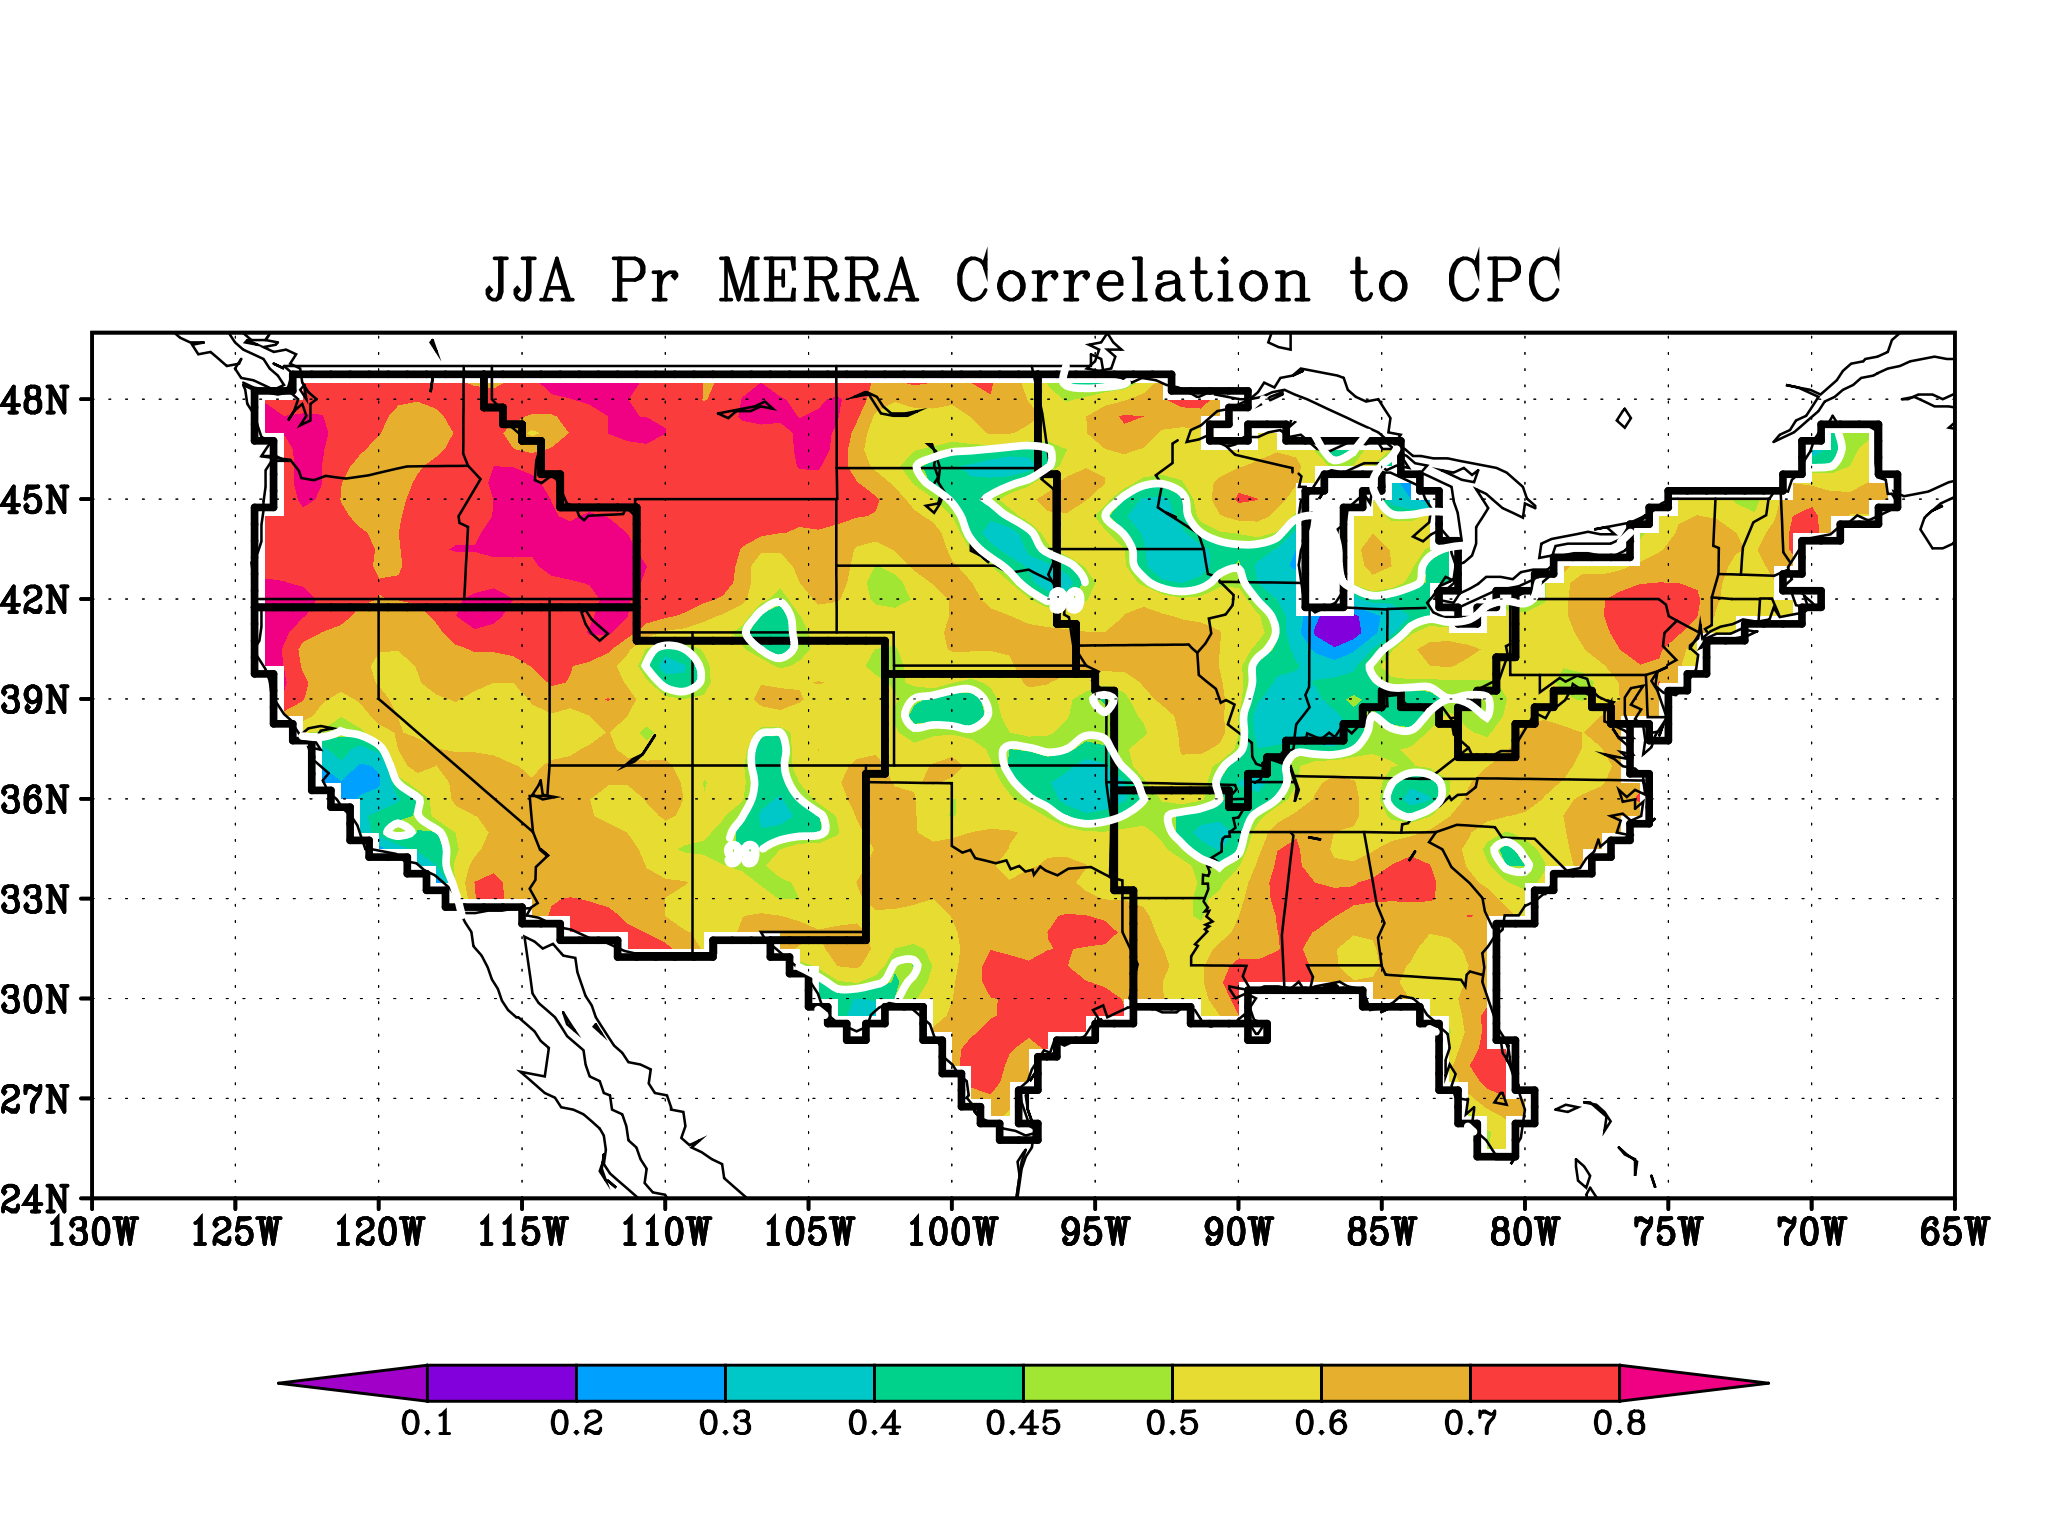
The ability of reanalyses to reproduce the seasonal variations of precipitation and temperature over the United States during summer, when model forecasts have characteristically weak forecast skill, is assessed. Precipitation variations are reproduced well over much of the United States, especially in the Northwest, where ENSO contributes to the large-scale circulation. Some significant biases in the seasonal mean do exist. The weakest regions are the Midwest and Southeast, where land–atmosphere interactions strongly affect the physical parameterizations in the forecast model. In particular, the variance of the Modern-Era Retrospective Analysis for Research and Applications (MERRA) is lower than observed (extreme seasonal averages are weak), and the variability of the Interim ECMWF Re-Analysis (ERA-Interim) is affected by spurious low-frequency trends. Surface temperature is generally robust among the reanalyses examined, though; reanalyses that assimilate near-surface observations have distinct advantages. Observations and forecast error from MERRA are used to assess the reanalysis uncertainty across U.S. regions. These data help to show where the reanalysis is realistically replicating physical processes, and they provide guidance on the quality of the data and needs for further development.

Figure: MERRA Summer Seasonal mean precipitaiton correlated to CPC Gauge observations. The white contour indicates statistically significant positive correlation at 99%.

MERRA JJA Seasonal Precip correlated to CPC Gauge Observations


Add new comment

CAPTCHA
This question is for testing whether or not you are a human visitor and to prevent automated spam submissions.

Global 0.5 deg hourly land surface air temperature datasets from 1948-2009

Created by xubin on - Updated on 07/18/2016 10:13

Land surface air temperature (SAT) is one of the most important variables in weather and climate studies, and its diurnal cycle and day-to-day variation are also needed for a variety of applications. Global long-term hourly SAT observational data, however, do not exist. While such hourly products could be obtained from global reanalyses, they are strongly affected by model parameterizations and hence are found to be unrealistic in representing the SAT diurnal cycle (even after the monthly mean bias correction) (see Figure below; left panels: SAT anomalies; right panels: SAT differences between reanalyses and CRU).

Global hourly 0.5-degree SAT datasets are developed here based on four reanalysis products [MERRA (1979-2009), ERA-40 (1958-2001), ERA-Interim (1979-2009), and NCEP/NCAR (1948-2009)] and the CRU TS3.10 data for 1948-2009. Our three-step adjustments include the spatial downscaling to 0.5-degree grid cells, the temporal interpolation from 6-hourly (in ERA-40 and NCEP/NCAR) to hourly using the MERRA hourly SAT climatology for each day (and the linear interpolation from 3-hourly in ERA-Interim to hourly), and the mean bias correction in both monthly mean maximum and minimum SAT using the CRU data.

The final products have exactly the same monthly maximum and minimum SAT as the CRU data, and perform well in comparison with in situ hourly measurements over six sites and with a regional daily SAT dataset over Europe. They agree with each other much better than the original reanalyses, and the spurious SAT jumps of reanalyses over some regions are also substantially eliminated. One of the uncertainties in our final products can be quantified by their differences in the true monthly mean (using 24 hourly values) and the monthly averaged diurnal cycle. The datasets will be available to the community in late 2013.

The paper is available at: http://journals.ametsoc.org/doi/abs/10.1175/JCLI-D-12-00682.1

Data Access DS193.0: NCAR

Add new comment

CAPTCHA
This question is for testing whether or not you are a human visitor and to prevent automated spam submissions.

Representation of tropical subseasonal variability of precipitation in global reanalyses

Created by daehyunk on - Updated on 07/18/2016 10:13

From Daehyun Kim, M.-I. Lee, D. Kim, S.D. Schubert, D. E. Waliser, and B. Tian, Clim. Dyn., doi 10. 1007/s00382-013-1890-x. Online First.


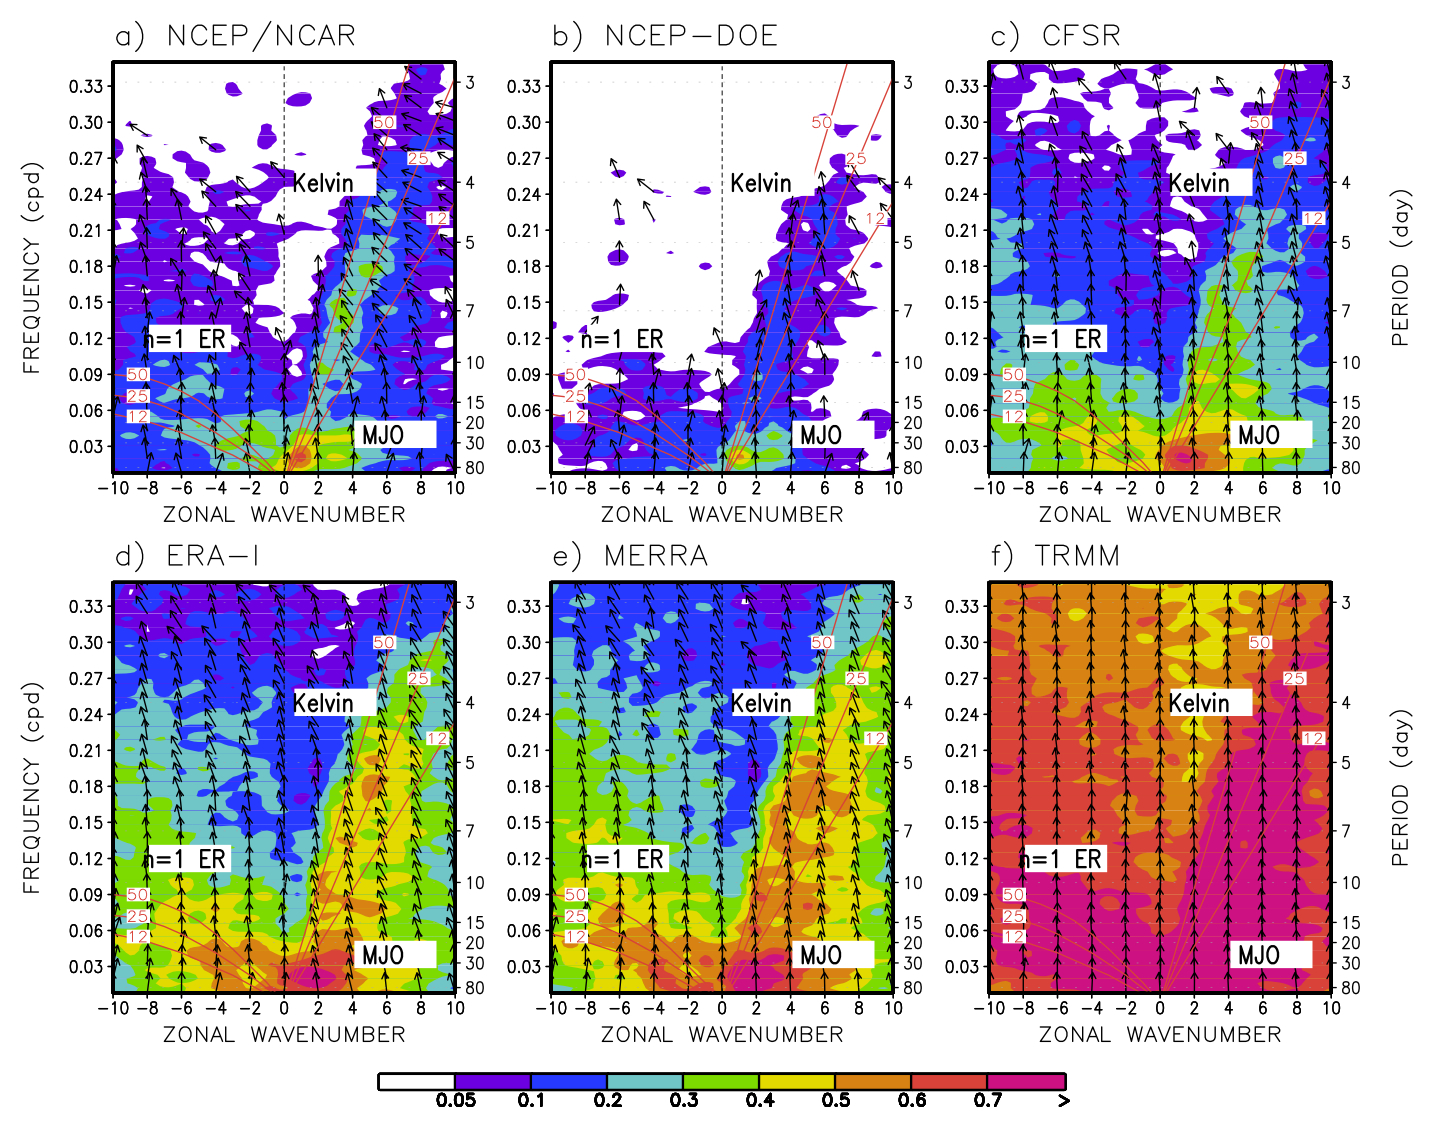
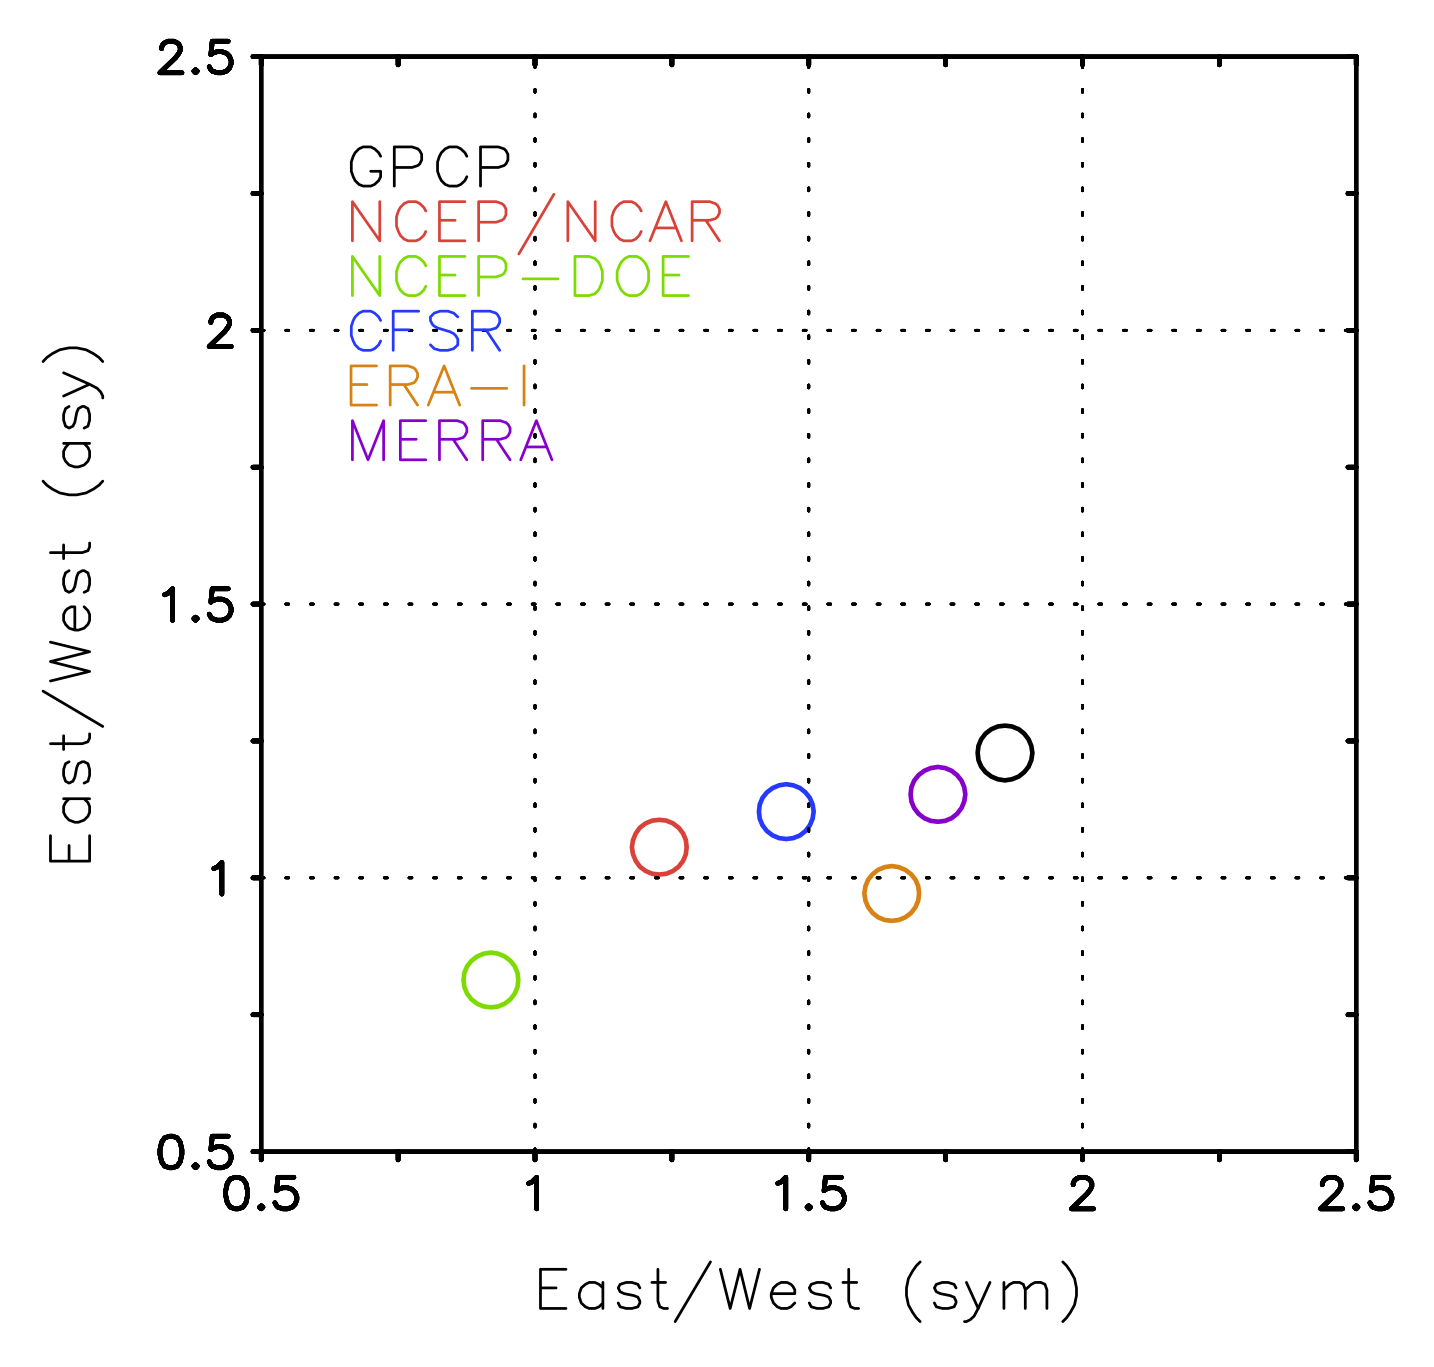
     The study examined the representation of tropical subseasonal variability of precipitation in five global reanalyses (RAs) – the three generations of global RAs from NCEP (NCEP/NCAR, NCEP-DOE, and CFSR), and two other RAs from ECMWF (ERA-I) and NASA/GSFC (MERRA). The modern RAs show significant improvement in their representation of the mean state and subseasonal variability of precipitation when compared to the two older NCEP RAs. The modern RAs also show higher coherence of CCEWs with observed variability and more realistic eastward propagation of the MJO precipitation. However, the probability density of rain intensity in the modern RAs shows discrepancies from observations that are similar to what the old RAs have. The study also indicates that the modern RAs exhibit common systematic deficiencies in the variability and the phase relationship of high-frequency CCEWs other than the MJO. The study leaves a detailed analysis of impacts driven by assimilating moisture-related satellite radiances in the modern RAs for further study, which are speculated as at least one of the potential sources for the improvement from the old RAs in the representation of MJO and CCEWs.


Scatter plot between East/West power ratios of symmetric and antisymmetric MJO. The ratio is defined as the sum of power over the MJO band (wavenumber 1-5, period 30-60 days) divided by that of the westward propagating counterpart.


Coherence squared (colors) and phase lag (vectors) between GPCP precipitation and precipitation from a) NCEP/NCAR, b) NCEP-DOE, c) CFSR, d) ERA-I, e) MERRA, and f) TRMM. The symmetric spectrum is shown. Spectra were computed at individual latitude, and then averaged over 15oS–15oN. Vectors represent the phase by which reanalysis precipitation lags GPCP, increasing in the clockwise direction. A phase of 0o is represented by a vector directed upward.

Add new comment

CAPTCHA
This question is for testing whether or not you are a human visitor and to prevent automated spam submissions.

An assessment of the diurnal variation of upper tropospheric humidity in reanalysis data sets

Created by echung on - Updated on 08/09/2016 11:28

From Chung, E.-S., B. J. Soden, B. J. Sohn, and J. Schmetz (2013), An assessment of the diurnal variation of upper tropospheric humidity in reanalysis data sets, J. Geophys. Res. Atmos., 118, doi:10.1002/jgrd.50345.

Diurnal variations of upper tropospheric humidity in five different reanalysis datasets are compared over convective land and ocean regions, and evaluated using multiple satellite observations as a reference. All reanalysis datasets reproduce the day/night contrast of upper tropospheric humidity and the land/ocean contrast in the diurnal amplitude. The infrared satellite measurements indicate a slightly later diurnal minimum over land relative to most reanalyses and the microwave satellite measurements, suggesting that cloud masking of the infrared radiances may introduce a small (~ 3 hr) bias in the phase. One reanalysis exhibits a substantially different diurnal cycle over land which is inconsistent with both infrared and microwave satellite measurements and other reanalysis products. This product also exhibits a different covariance between vertical velocity, cloud water and humidity than other reanalyses, suggesting that the phase bias is related to deficiencies in the parameterization of moist convective processes.

Diurnal anomaly of Meteosat-5 water vapor channel brightness temperature simulated from NCEP/DOE, 20th Century Reanalysis, ERA-40, ERA-Interim, and MERRA over the convectively active regions of Africa and the Atlantic Ocean for the period 1984-2004. The red lines denote the diurnal anomaly of observed brightness temperature for the same period.

Add new comment

CAPTCHA
This question is for testing whether or not you are a human visitor and to prevent automated spam submissions.

Recent Strengthening of the Pacific Walker circulation

Created by michelle.lheureux on - Updated on 08/09/2016 11:28

Citation: L'Heureux, M.L., S. Lee, and B. Lyon, 2013: Recent multidecadal strengthening of the Walker circulation across the tropical Pacific. Nature Clim Change, doi: 10.1038/nclimate1840.

Ten different datasets from reanalyses, reconstructions, and in situ measurements are examined for sea level pressure (SLP) trends over the tropical Pacific.  Instead of fitting a single least squares linear trend through the entire 1900-2011 record, running linear trends are calculated every six months over varying length windows (10-, 20-, 30-, and 40-year).  For the 20-40 year windows over Indonesia (110-160E, 10S-10N), a gradual increase from negative to positive SLP trends is evident beginning in 1910-1920 (see top figure below).  Then, starting in 1955-1965, the the positive trends cease growing and eventually trends become significantly negative over the last several decades. In contrast, over the Eastern Pacific (130-80W, 10S-10N), trends are less significant but there is evidence for a tendency towards positive SLP trends starting in the late 1950s or 1960s (see bottom figure below).  The tendency towards lower SLP over Indonesia and higher SLP over the eastern Pacific suggests a strengthening Walker circulation over the last half of the 20th century.  This increase in the Walker circulation becomes even more apparent when ENSO variability (using the Nino-3.4 index) is linearly removed from the datasets.  Moreover, the tendency for a strengthening Walker circulation appears to be nearly concurrent with the shift toward positive trends in global average temperatures.

While not shown below (see supplementary info), we note that a significant lack of in situ SLP data (ICOADS.v2.5) over the tropical Pacific is linked to larger disagreement in the datasets during the first half of the 20th century. Therefore, caution is recommended when interpreting the observed linear SLP trends prior to the 1950s.   

SLP linear trends for 10-, 20-, 30-, 40-year moving windows from January 1900 to December 2011.  (TOP FIGURE) Trends for the region over Indonesia (110–160E, 10S–10N) and (BOTTOM FIGURE) for the region over the eastern Pacific Ocean (130–80W, 10S–10N) . SLP is expressed as the change (hPa) over the window length. Grey shading represents the 95% confidence level based on a two-tailed Student’s t-test. The dashed, horizontal lines represent the 95% range of trends based on 1,000 synthetic AR(1) time series. The x axis shows the initial year of the trend (for 10-year windows, 1950 denotes the 1950–1959 trend). 

Add new comment

CAPTCHA
This question is for testing whether or not you are a human visitor and to prevent automated spam submissions.

Dispersing the fog of ignorance

Created by philip@brohan.org on - Updated on 08/09/2016 11:28

All the best reanalyses include uncertainty estimates, and I've been using fog to mark times and regions where the analyses are too uncertain to provide much value. This works well with 20CR - it's easy to make a compelling plot showing a relatively low spread in regions with lots of observations, and a much wider spread elsewhere.

But there are many different possible metrics for uncertainty: I originally chose the ratio of ensemble standard deviation (esd) to climatological standard deviation (csd), and this mostly works, but it undervalues the reanalysis in places where there is a lot of weather. If a big storm is coming but the magnitude and location are uncertain, esd can be very large, but the reanalysis is still informative. So I should include signal magnitude as well as spread.

The obvious approach is some combination of csd/esd and (em-cm)/csd (em=ensemble mean). Gil pointed me at the concept of Relative Entropy - more impressively known as Kullback-Leibler divergence. The K-L divergence between the reanalysis ensemble and the climatological distribution (Dkl(R||C)) is the information lost when using the climatology as an estimator of the reanalysis. In general it's hard to calculate, but under a reasonable set of simplifying assumptions:

Dkl(R||C) = 1/2*(ln(csd**2/esd**2) + (esd**2/csd**2)-1 + (em-cm)**2/csd**2)

(That's for a single variable - I'm only using MSLP here. It does generalise to multiple variables (could add temperature, precip etc.), but results are dominated by the variable where 20CR has most skill, so just using MSLP is reasonable).

So where the analysis is unconstrained by observations, esd=csd and em=cm and Dkl(R||C)=0 (might as well use the climatology). As we add observational constraints either esd will shrink or em will become different from cm or both, and Dkl(R||C) becomes positive.

This would be fine if the reanalysis were based on a perfect model, but in reality, in the absence of observational constraints esd!=csd and em!=cm and Dkl(R||C) is large. I wangle round this by replacing climatology with a, somewhat arbitrary, Uninformed distribution (U) and choose usd=max(esd,csd) and um=30-year running mean from reanalysis. Dkl(R||U) is then 0 where the reanalysis is unconstrained and increases with observational constraints.

The results look like this (plots show prmsl and 10m wind actuals, and air.2m anomalies - yellow dots mark observations):

For 1987:

and for 1918:

I do still have to choose an arbitrary threshold for fog (here Dkl(R||U) <=1) but it doesn't make an enormous difference as Dkl(R||U) goes from zero to big quite abruptly.  I'd like to make such a video for the entire 140-year span of 20CR, to show the fog dissipating as the observations coverage increased, but it would take forever to render and hours even to watch. But the method is general - it should work at any timescale - so I've made the long video using monthly data:

Monthly weather is a bit random and discontinuous, but it does show the improvement in 20CR as the observations coverage increases. I like the variable but persistent effect of the Port Stanley observation in the Falklands.

It still feels a bit wrong to me: I was originally working just with the ensemble spread, and Dkl is exponentially more sensitive to the mean anomaly than to the spread - so the weather matters much more than the analysis precision. But the literature seems clear that it's the right metric.

Add new comment

CAPTCHA
This question is for testing whether or not you are a human visitor and to prevent automated spam submissions.

Ozone highs and tropopause features

Created by stefan.broennimann on - Updated on 07/18/2016 10:13

Brönnimann, S., and G.P. Compo, 2012: Ozone highs and associated flow features in the first half of the twentieth century in different data sets. Meteorol. Zeit., 21, 49-59, doi:10.1127/0941-2948/2012/0284 .

In order to better understand weather extremes, their relation to the large-scale climate variability, and their possible changes over time, observation-based atmospheric data sets are required that reach back in time as far as possible and that provide information on the 3-dimensional structure of the atmosphere. A number of new such data sets have been published in recent years, including historical observations, reanalyses, and reconstructions, some of which reach back into the 19th century. However, their usefulness for studying weather extremes remains to be shown. Here we compare some of these historical data sets in the first half of the twentieth century, focusing on one specific type of extreme, namely “ozone highs”. Using historical total ozone observations as a starting point, we assess dynamical links between total ozone, the flow near the tropopause, and tropospheric circulation in the “Twentieth Century Reanalysis” (20CR), historical radiosonde and air craft observations, and hand drawn historical maps. Selected cases are presented for two regions (Europe and China). Ozone highs over Europe in the 1920s to 1950s were qualitatively well reproduced in 20CR and could mostly be interpreted in the context of cut-off lows. Some of these coincided with a blocking high over the North Atlantic or with vigorous cold-air outbreaks. One of these cases is analysed in more detail. Ozone highs over China in the 1930s may have been related to changes in the jet stream and the subtropical tropopause, but they were not always well reproduced in 20CR. The results demonstrate that, in many of the cases, the available data allow a dynamical interpretation. This confirms the potential of the available data and techniques to extend the length of atmospheric data sets suitable for studying extremes.

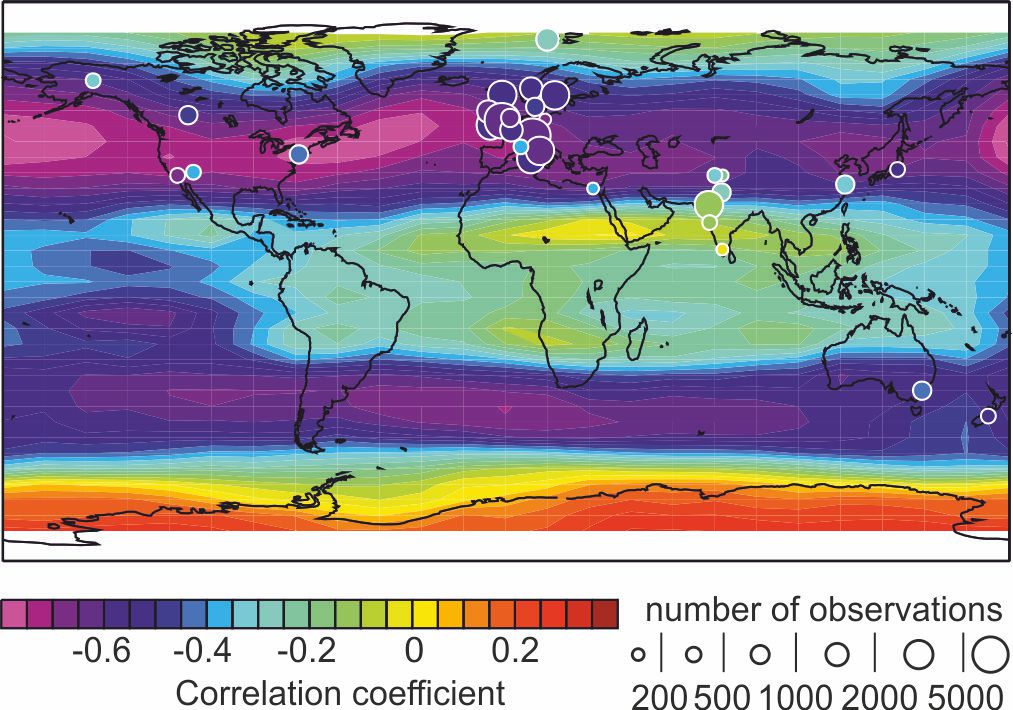
Anomaly correlations between 200 hPa GPH in 20CR and historical ground-based total ozone observations (1924-1963, circles) and between 200 hPa GPH in ERA-Interim and satellite-based total ozone observations (NIWA data set, 1997-2007, contours). The size of the circle indicates the number of observations. THe mean annual cycle has been subtracted from all seres.

Meteorological fields for two cases (top: 26 January 1934, bottom: 26 January 1936) with high observed total ozone at Zi-Ka-Wei, China, in the 1930s. (left) Hand drawn historical weather chart with sea-level pressure (mm Hg) and wind vectors, (middle) sea-level pressure (solid contours, hPa), ensemble spread standard deviation) of sea-level pressure (dotted contours, hPa), and winds at the 0.995 sigma level in 20CR, (right) total ozone (colours) and wind speed at the tropopause level (contours, in m/s) from 20CR. The coloured circles indicate the observed total ozone values.

Add new comment

CAPTCHA
This question is for testing whether or not you are a human visitor and to prevent automated spam submissions.

Extreme winds at northern midlatitudes in 20CR

Created by stefan.broennimann on - Updated on 08/09/2016 11:28

Brönnimann, S., O. Martius, H. von Waldow, C. Welker, J. Luterbacher, G.P. Compo, P.D. Sardeshmukh, and T. Usbeck, 2012:Extreme winds at northern mid-latitudes since 1871. Meteorol. Zeit., 21, 13-27, doi: 10.1127/0941-2948/2012/0337.

Studying a sufficiently large sample of extremes or analysing the statistics of their occurrence, including trends, is hampered by the length of the existing observation-based record. New data sets such as the Twentieth Century Reanalysis (20CR), which consists of an ensemble of 56 members, significantly extend our record back in time. In this paper, we present examples of extremes of winds at northern hemisphere mid-latitudes in 20CR to illustrate challenges and opportunities for analysing extremes over a longer period than previously possible. For four representative storms from Europe and North America, 20CR provides a relatively good depiction of the synoptic-scale meteorological development, although it misses smaller scale features as well as local effects due to orography. For analysing trends of extreme winds, it is shown that the individual ensemble members should be used, rather than the ensemble mean, which appears to be biased towards lower wind speeds early in the record. For the studied locations, decadal variability and trends can best be characterised after around 1950, when the ensemble variance remains consistent. Different methodological approaches for studying changes in extreme winds are discussed. Finally, we show hemispheric maps of trends in extreme wind speeds since 1950.


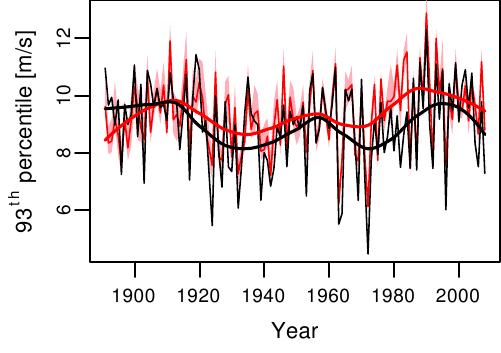
The seasonal (Oct-Mar) 93rd percentile of daily wind maxima from hourly observations from Zurich (black), from the 20CR ensemble mean 0.995 sigma level wind at the nearest grid point (red) and for the corresponding range from the ensemble members. The thick lines are smoothed with a spline function.

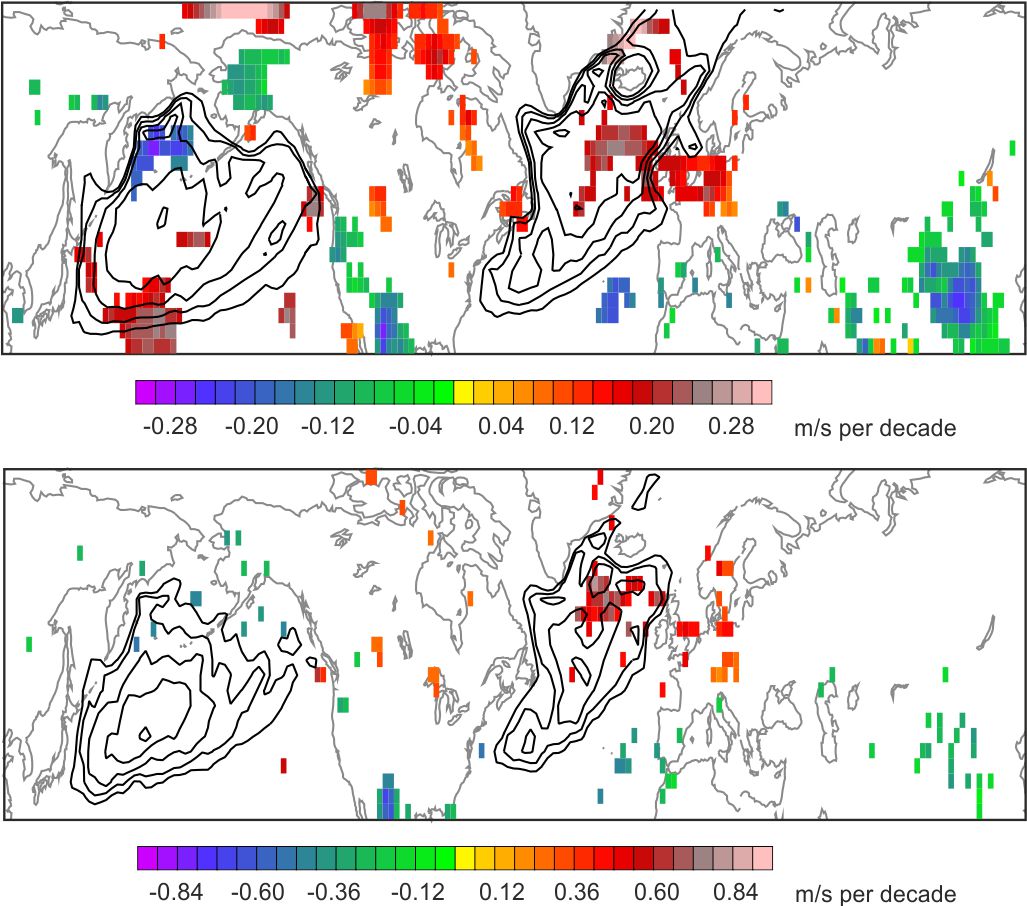
Map of the trend in the annual 98th percentile (top) and annual maximum (bottom) 0.995 sigma level wind  from 20CR for the period 1950-2008. Shown is the mean of the trend from the individual members, but only if 90% of the ensemble members exhibit a significant (p<0.05) trend. Contours denote the ensemble average of the 98th percentile and annual maximum 0.995 sigma level wind, respectively, with contours starting at 20 m/s (top) and 30 m/s (bottom) and an interval of 1 m/s.

Add new comment

CAPTCHA
This question is for testing whether or not you are a human visitor and to prevent automated spam submissions.

Arctic temperatures in different reanalyses

Created by stefan.broennimann on - Updated on 08/09/2016 11:29

Brönnimann, S., A.N. Grant, G.P. Compo,T. Ewen, T. Griesser, A.M. Fischer, M. Schraner, and A. Stickler, 2012: A multi-data set comparison of the vertical structure of temperature variability and change over the Arctic during the past 100 years. Cli. Dyn., 39, 1577-1598, doi:10.1007/s00382-012-1291-6.

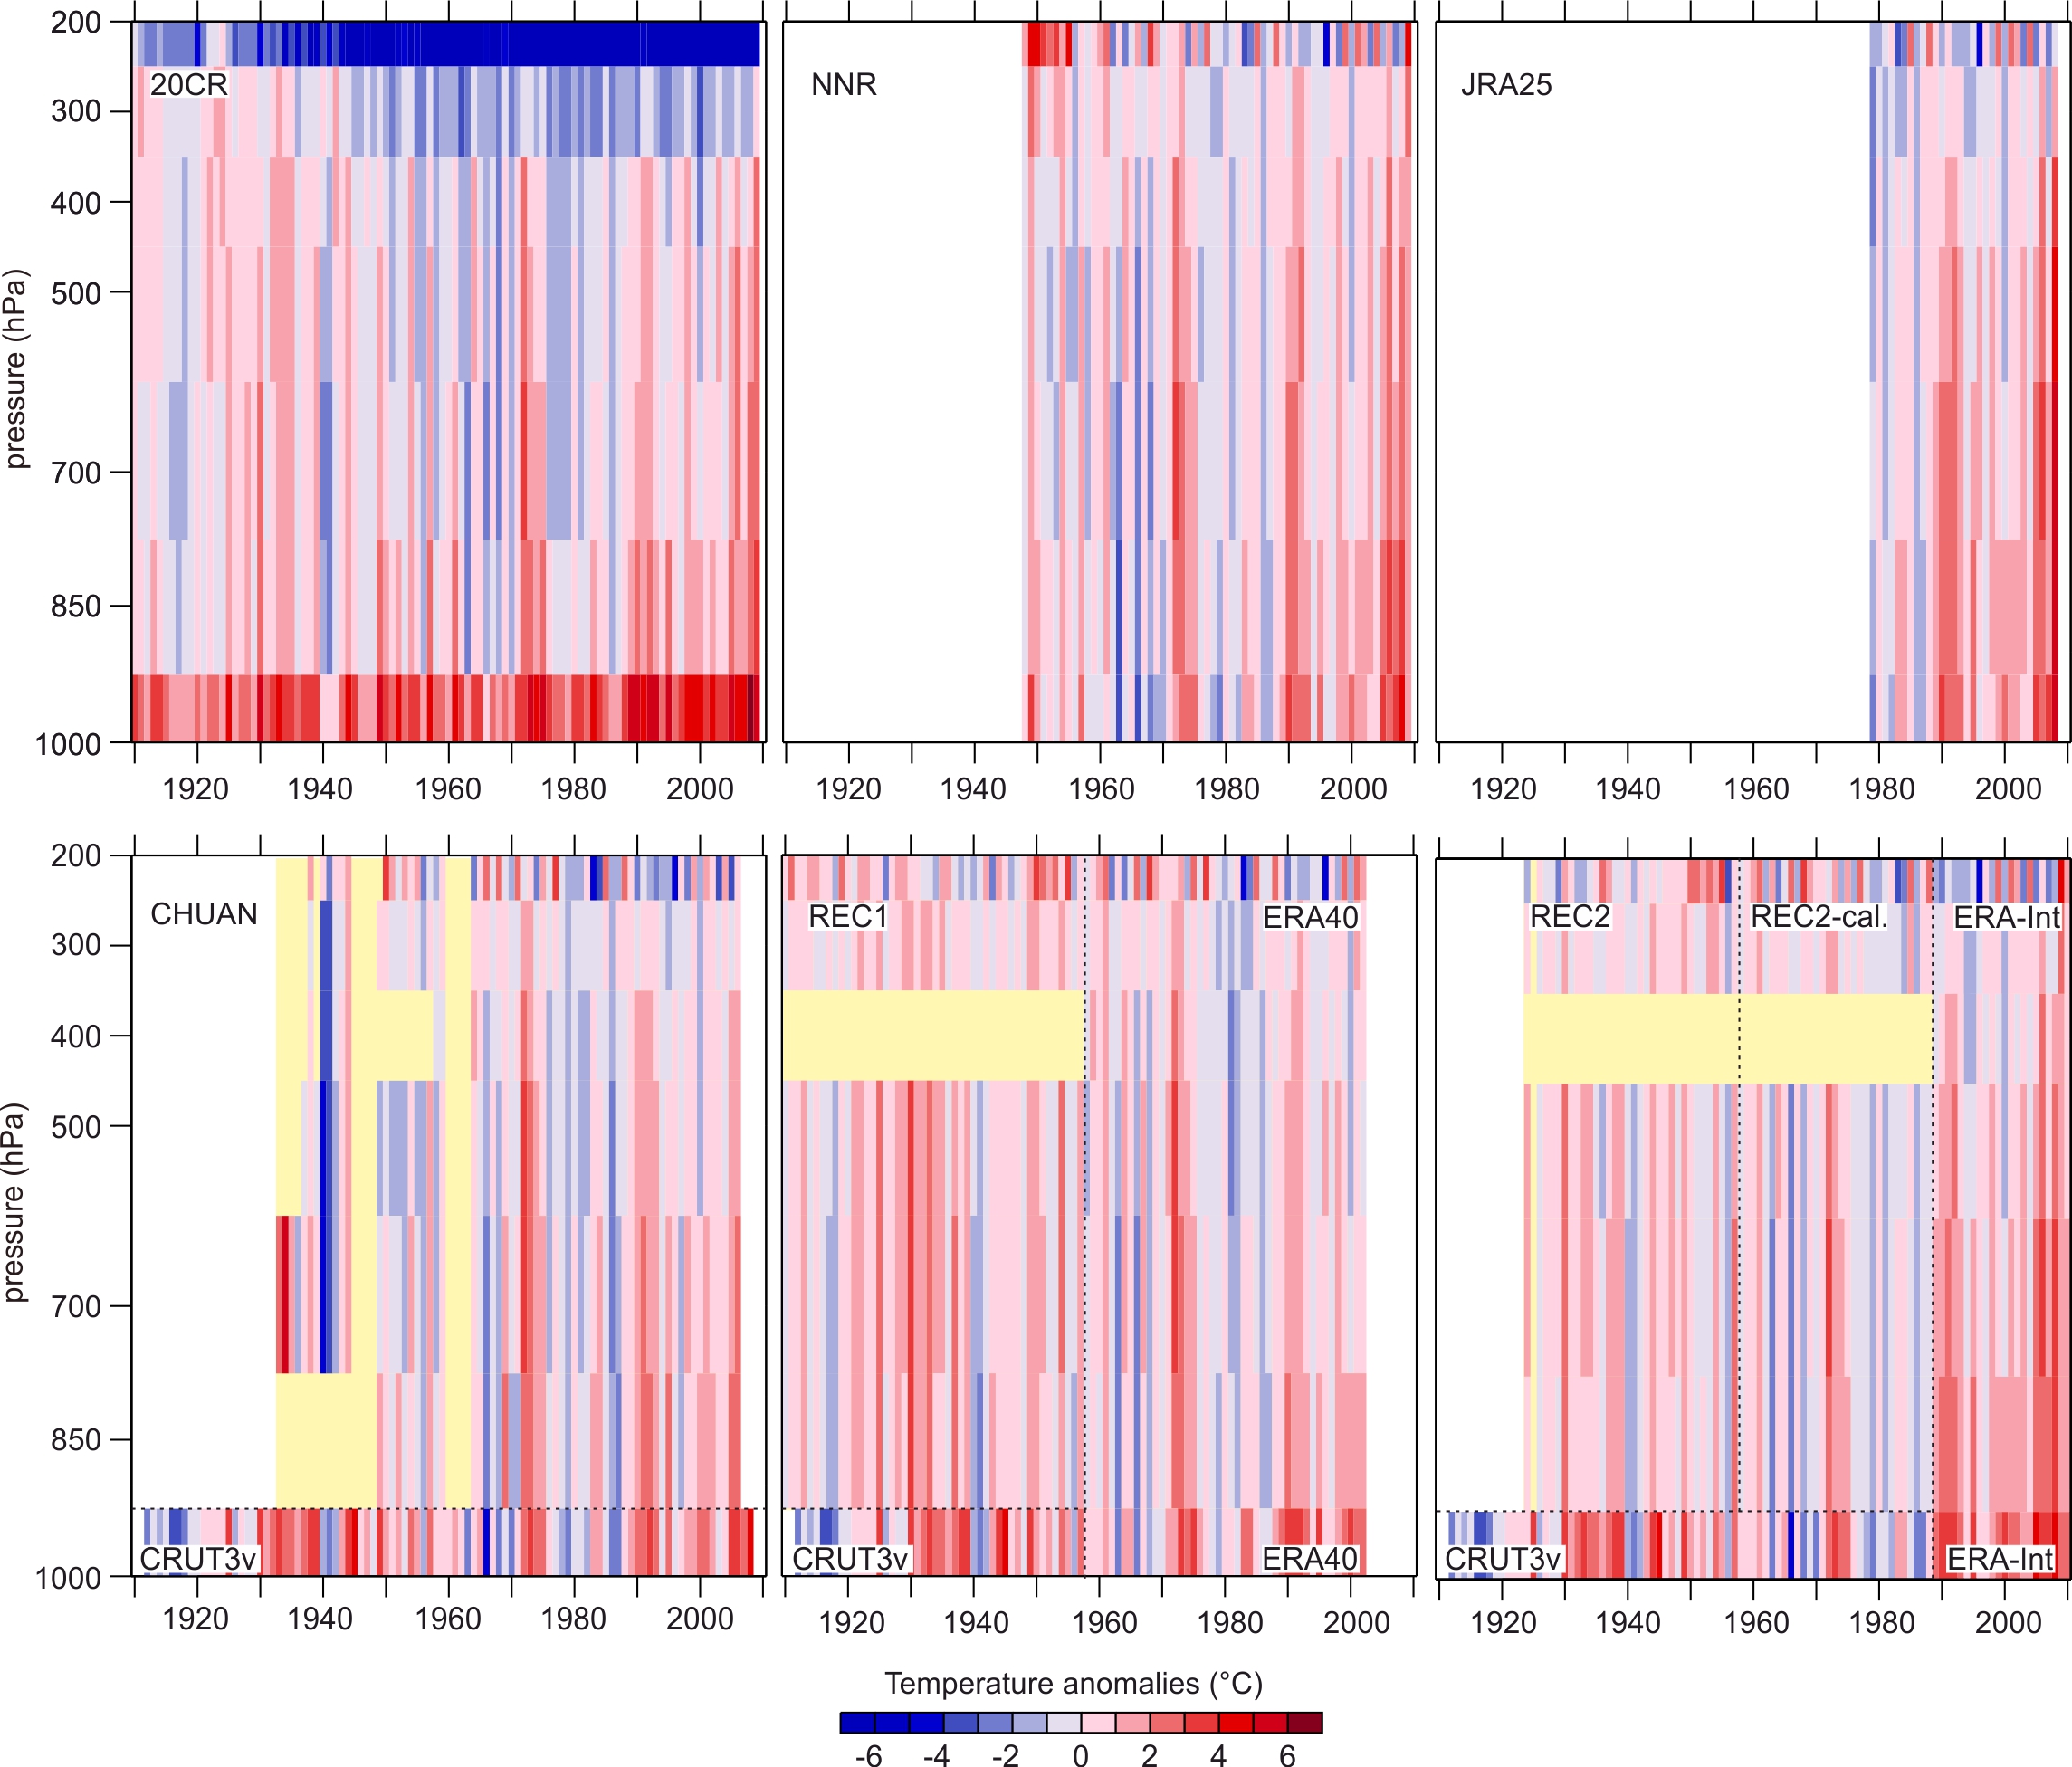
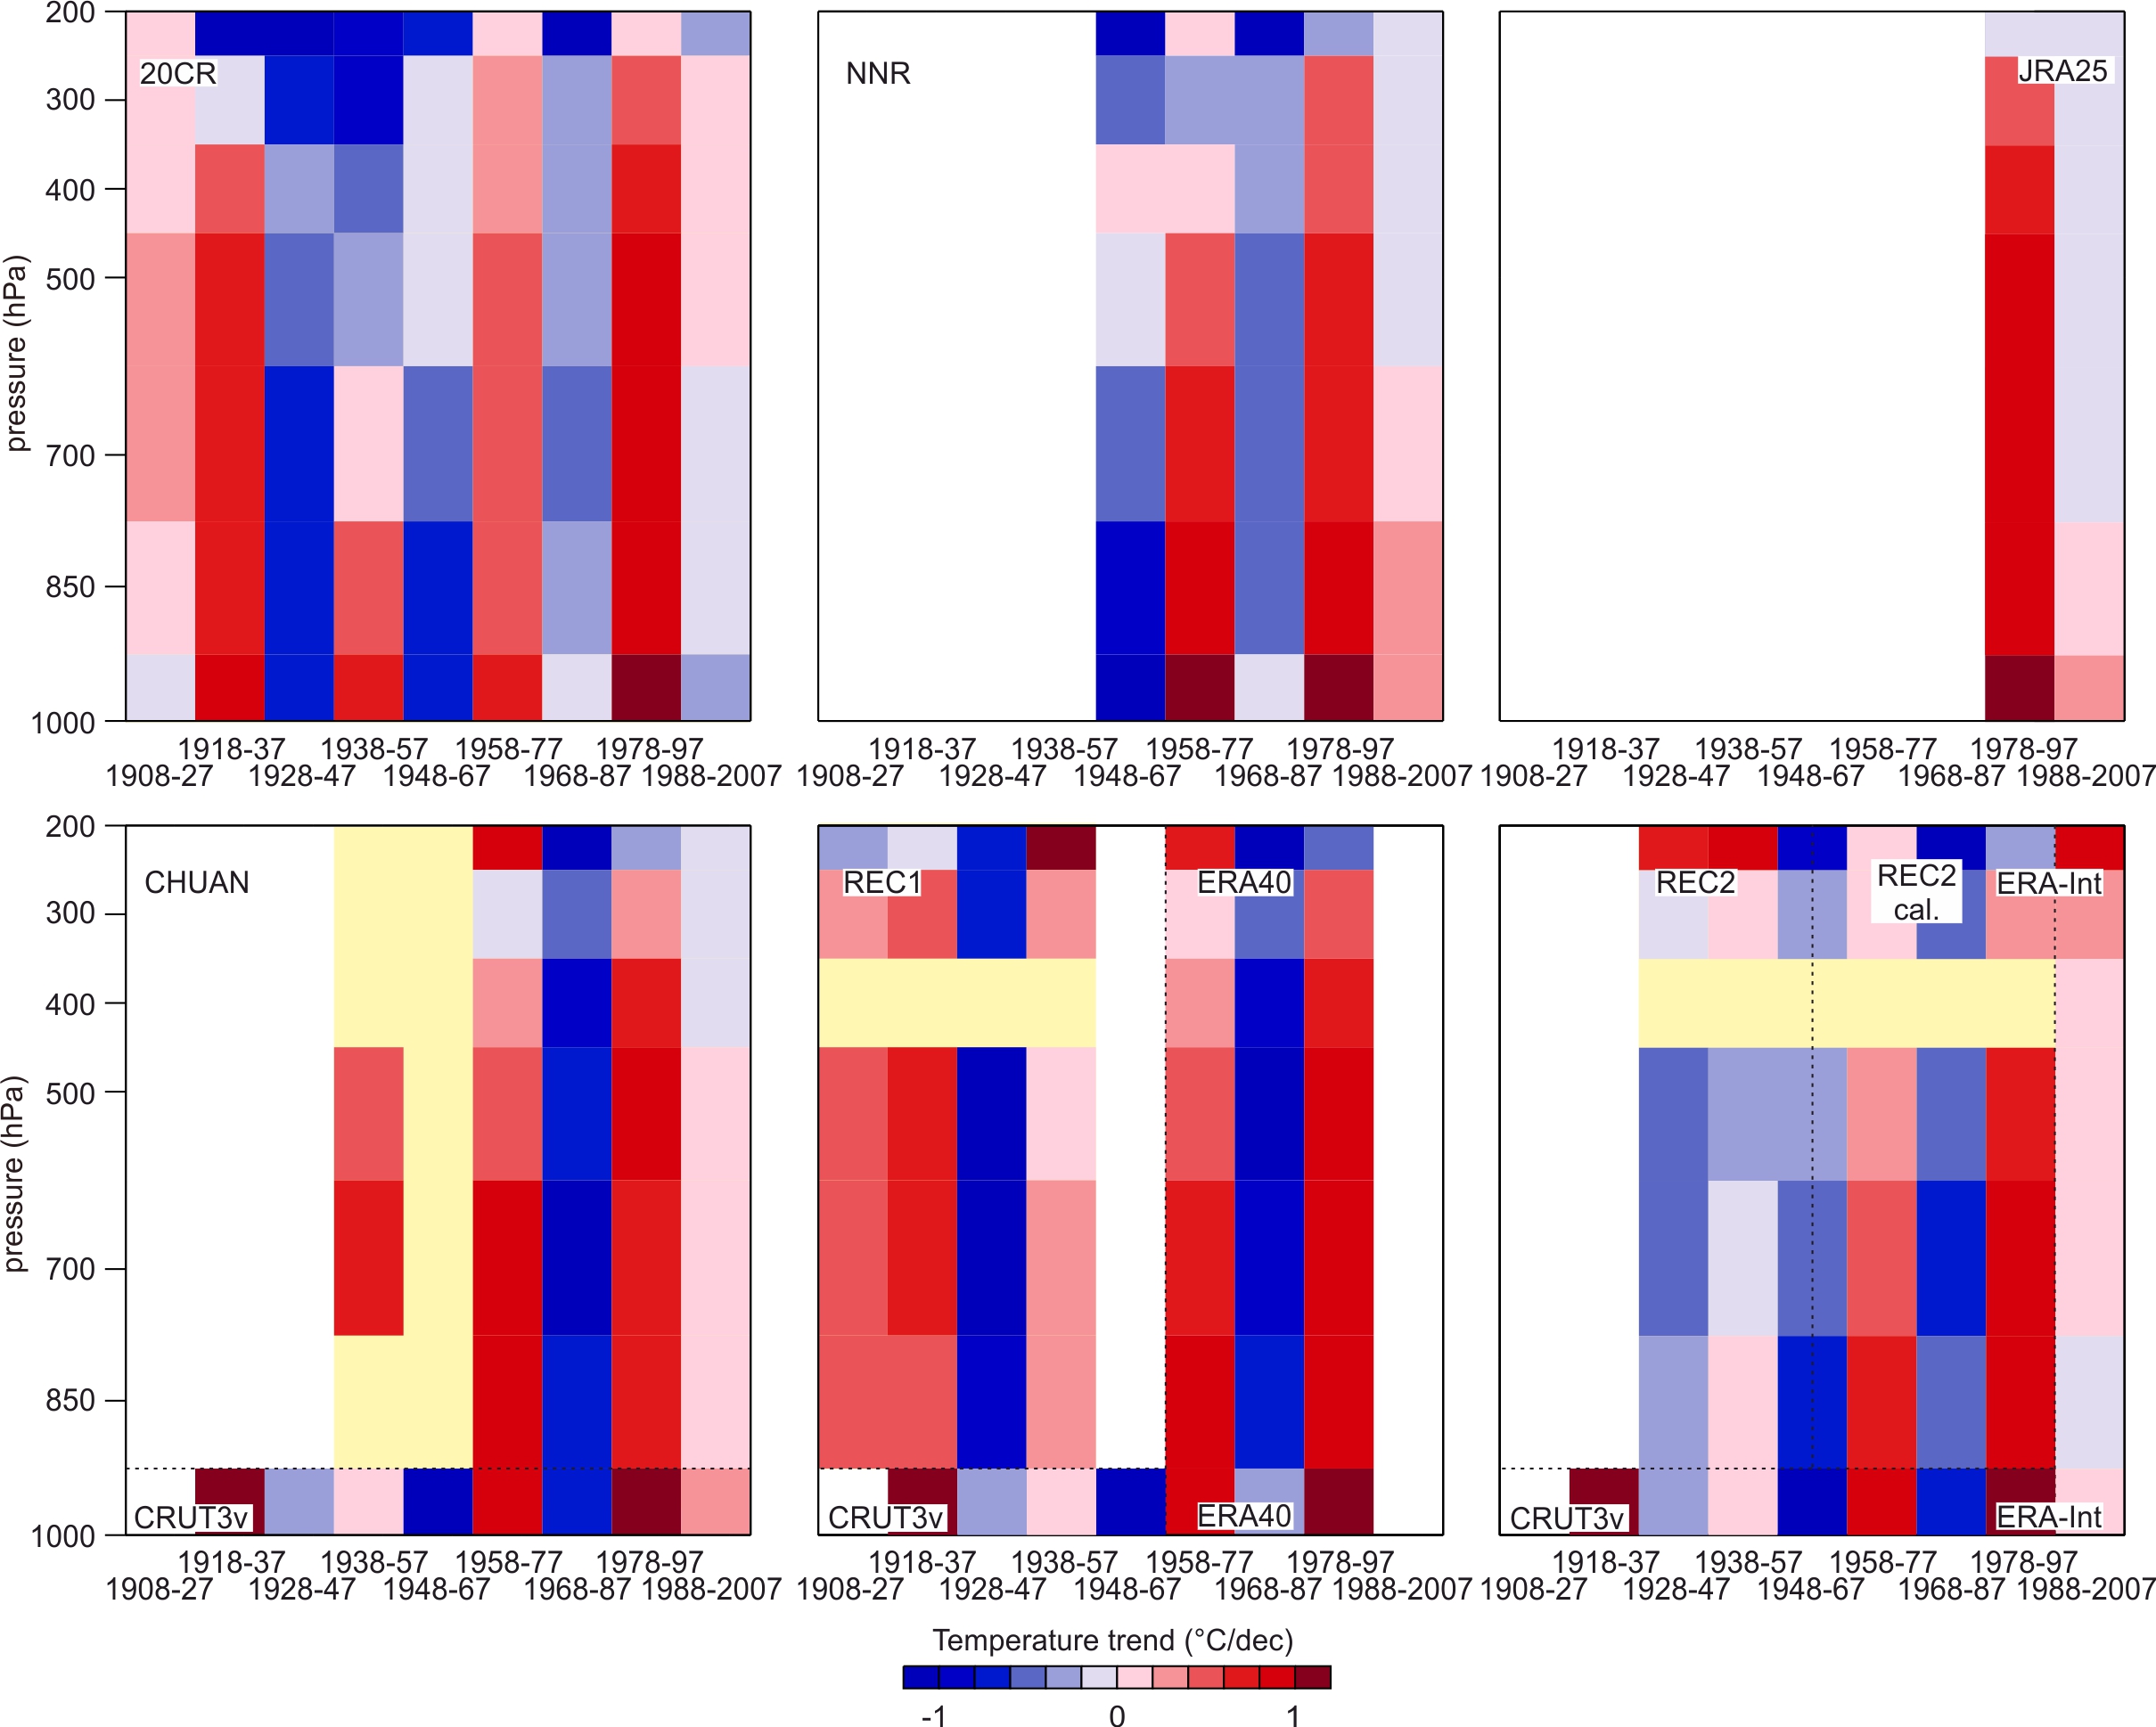
We compare the daily, interannual, and decadal variability and trends in the thermal structure of the Arctic troposphere using eight observation-based, vertically resolved data sets, four of which have data prior to 1948. Comparisons on the daily scale between historical reanalysis data and historical upper-air observations were performed for Svalbard for the cold winters 1911/1912 and 1988/89, the warm winters 1944/1945 and 2005/2006, and the International Geophysical Year 1957/58. Excellent agreement is found at mid-tropospheric levels. Near the ground and at the tropopause level, however, systematic differences are identified. On the interannual time scale, the correlations between all data sets are high, but there are systematic biases in terms of absolute values as well as discrepancies in the magnitude of the variability. The causes of these differences are discussed. While none of the data sets individually may be suitable for trend analysis, consistent features can be identified from analyzing all data sets together. To illustrate this, we examine trends and 20-yr averages for those regions and seasons that exhibit large sea-ice changes and have enough data for comparison. In the summertime Pacific Arctic and the autumn eastern Canadian Arctic, the lower tropospheric temperature anomalies for the recent two decades are higher than in any previous 20-yr period. In contrast, mid-tropospheric temperatures of the European Arctic in the wintertime of the 1920s and 1930s may have reached values as high as those of the late 20th and early 21st centuries.

Time-height cross-section of seasonal mean temperature anomalies as a function of pressure and time for different data sets for the European Arctic (see Fig. 2) in winter. All anomalies are with respect to NNR (1961-1990) except CRUTEM3v (self-climatology, see Brohan et al. 2006). Note that for visualisation purposes, non-overlapping data sets have been combined in some cases, indicated by dashed lines). Between the end of the reconstruction period of REC2 (1957) and the start of ERA-Interim (1989) we show the calibration period of REC2. Yellow colours denote missing values.

Trend in seasonally-averaged temperature profiles over 20-yr periods as a function of pressure and time period for different data sets for the European Arctic (see Fig. 2) in winter. Note that for visualisation purposes, non-overlapping data sets have been combined in some cases, indicated by dashed lines). Between the end of the reconstruction period of REC2 (1957) and the start of ERA-Interim (1989) we show the calibration period of REC2. Yellow colours denote missing values.

Add new comment

CAPTCHA
This question is for testing whether or not you are a human visitor and to prevent automated spam submissions.