From Daehyun Kim, M.-I. Lee, D. Kim, S.D. Schubert, D. E. Waliser, and B. Tian, Clim. Dyn., doi 10. 1007/s00382-013-1890-x. Online First.
The study examined the representation of tropical subseasonal variability of precipitation in five global reanalyses (RAs) – the three generations of global RAs from NCEP (NCEP/NCAR, NCEP-DOE, and CFSR), and two other RAs from ECMWF (ERA-I) and NASA/GSFC (MERRA). The modern RAs show significant improvement in their representation of the mean state and subseasonal variability of precipitation when compared to the two older NCEP RAs. The modern RAs also show higher coherence of CCEWs with observed variability and more realistic eastward propagation of the MJO precipitation. However, the probability density of rain intensity in the modern RAs shows discrepancies from observations that are similar to what the old RAs have. The study also indicates that the modern RAs exhibit common systematic deficiencies in the variability and the phase relationship of high-frequency CCEWs other than the MJO. The study leaves a detailed analysis of impacts driven by assimilating moisture-related satellite radiances in the modern RAs for further study, which are speculated as at least one of the potential sources for the improvement from the old RAs in the representation of MJO and CCEWs.

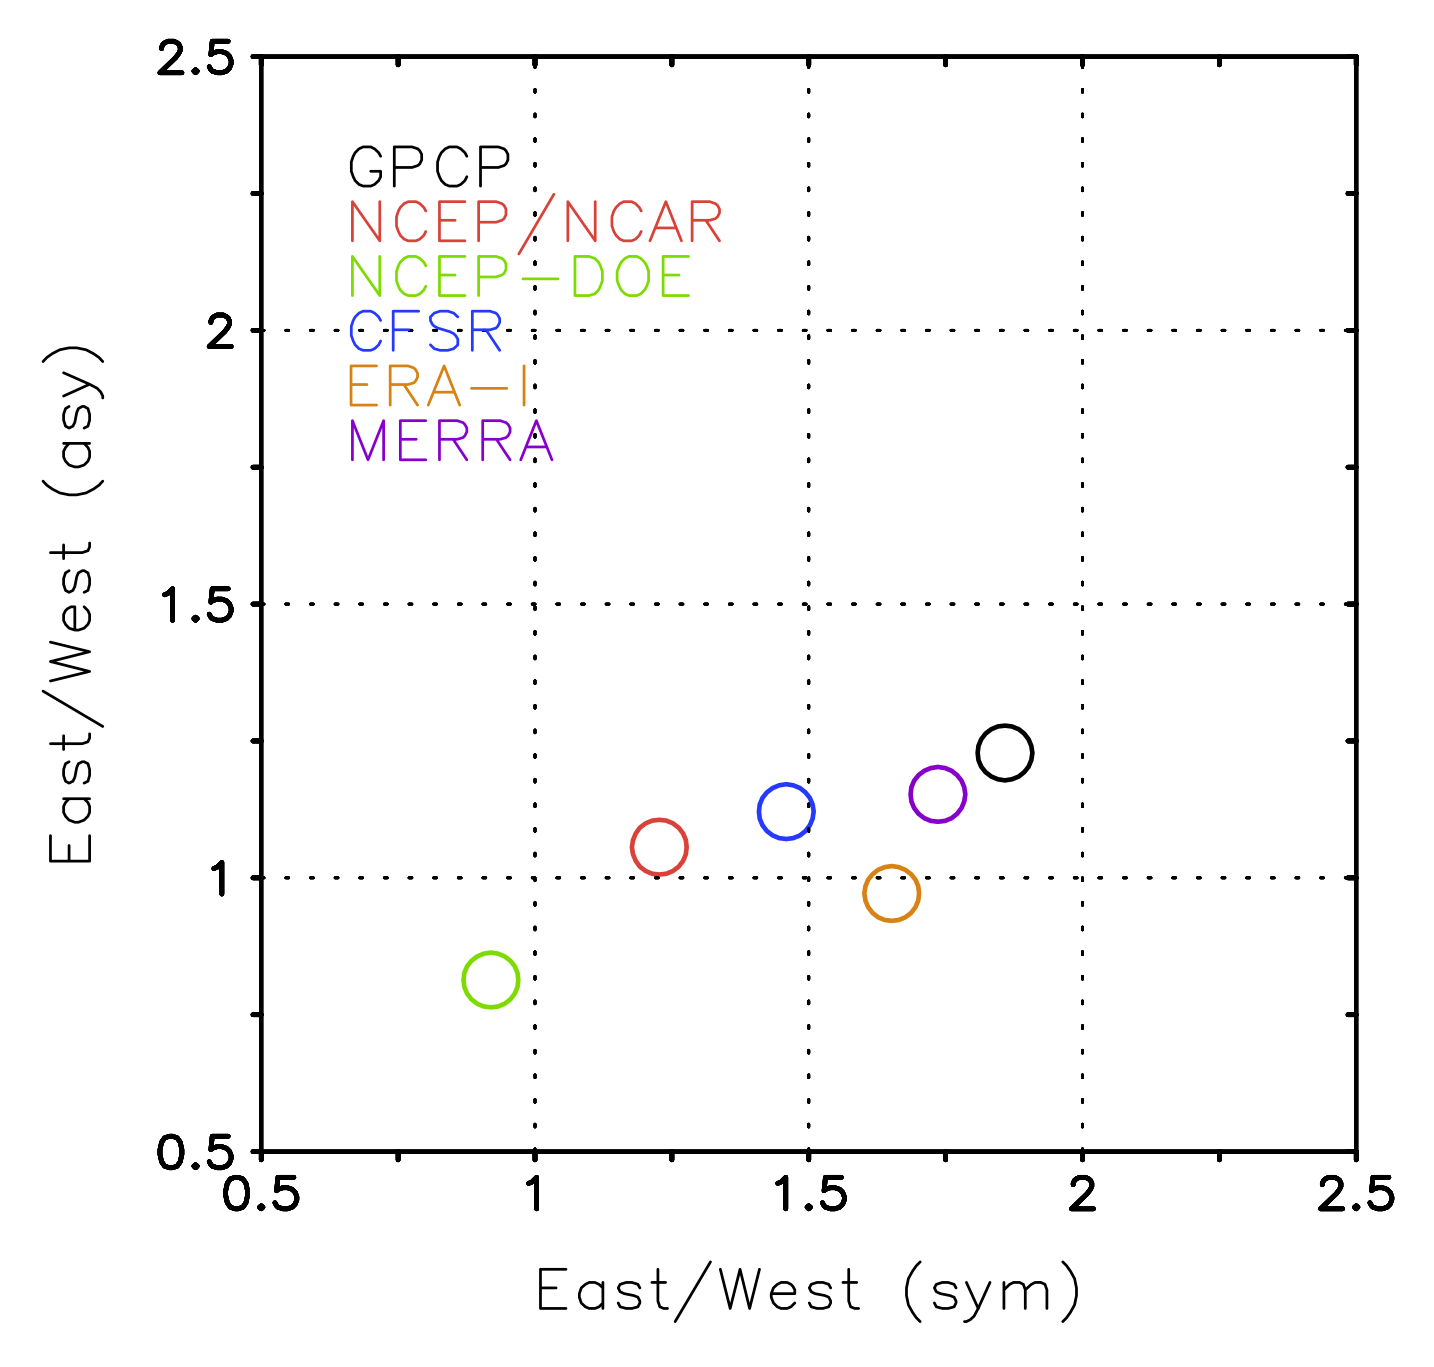
Scatter plot between East/West power ratios of symmetric and antisymmetric MJO. The ratio is defined as the sum of power over the MJO band (wavenumber 1-5, period 30-60 days) divided by that of the westward propagating counterpart.

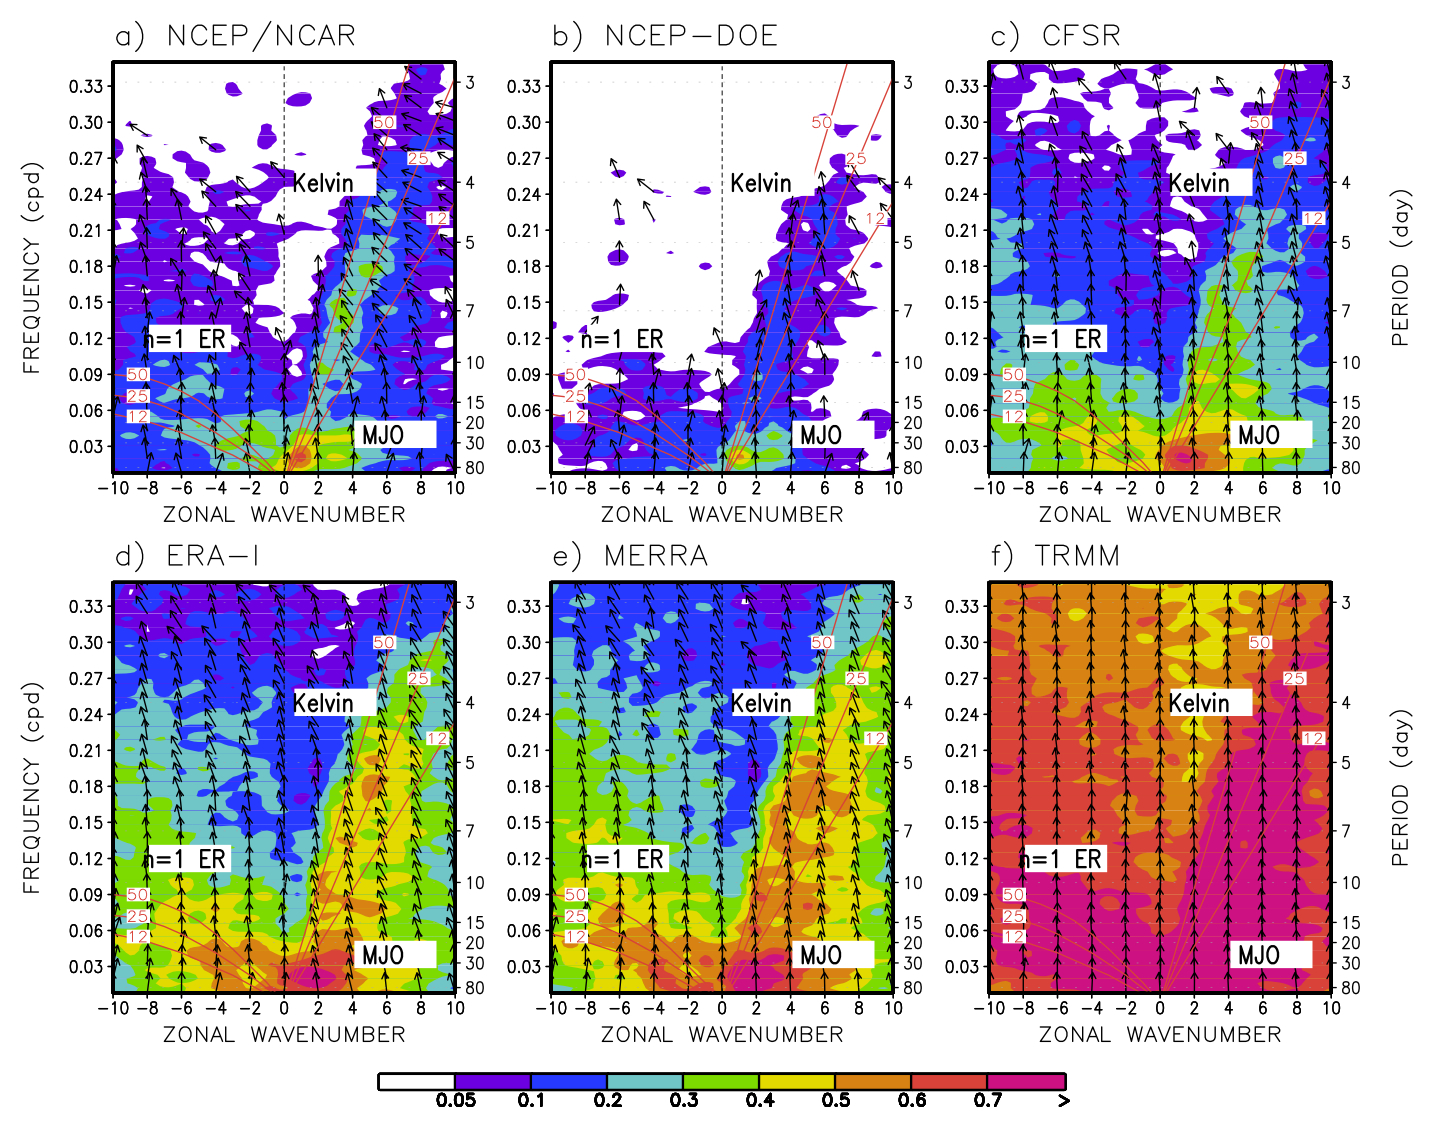
Coherence squared (colors) and phase lag (vectors) between GPCP precipitation and precipitation from a) NCEP/NCAR, b) NCEP-DOE, c) CFSR, d) ERA-I, e) MERRA, and f) TRMM. The symmetric spectrum is shown. Spectra were computed at individual latitude, and then averaged over 15oS–15oN. Vectors represent the phase by which reanalysis precipitation lags GPCP, increasing in the clockwise direction. A phase of 0o is represented by a vector directed upward.