Brönnimann, S., O. Martius, H. von Waldow, C. Welker, J. Luterbacher, G.P. Compo, P.D. Sardeshmukh, and T. Usbeck, 2012:Extreme winds at northern mid-latitudes since 1871. Meteorol. Zeit., 21, 13-27, doi: 10.1127/0941-2948/2012/0337.
Studying a sufficiently large sample of extremes or analysing the statistics of their occurrence, including trends, is hampered by the length of the existing observation-based record. New data sets such as the Twentieth Century Reanalysis (20CR), which consists of an ensemble of 56 members, significantly extend our record back in time. In this paper, we present examples of extremes of winds at northern hemisphere mid-latitudes in 20CR to illustrate challenges and opportunities for analysing extremes over a longer period than previously possible. For four representative storms from Europe and North America, 20CR provides a relatively good depiction of the synoptic-scale meteorological development, although it misses smaller scale features as well as local effects due to orography. For analysing trends of extreme winds, it is shown that the individual ensemble members should be used, rather than the ensemble mean, which appears to be biased towards lower wind speeds early in the record. For the studied locations, decadal variability and trends can best be characterised after around 1950, when the ensemble variance remains consistent. Different methodological approaches for studying changes in extreme winds are discussed. Finally, we show hemispheric maps of trends in extreme wind speeds since 1950.
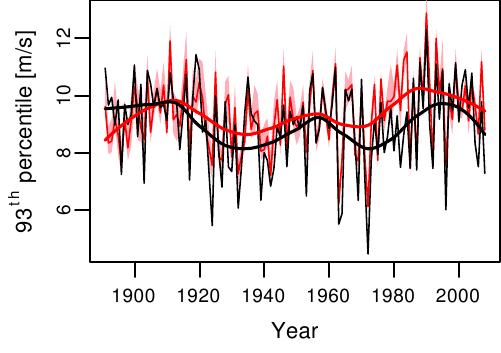
The seasonal (Oct-Mar) 93rd percentile of daily wind maxima from hourly observations from Zurich (black), from the 20CR ensemble mean 0.995 sigma level wind at the nearest grid point (red) and for the corresponding range from the ensemble members. The thick lines are smoothed with a spline function.
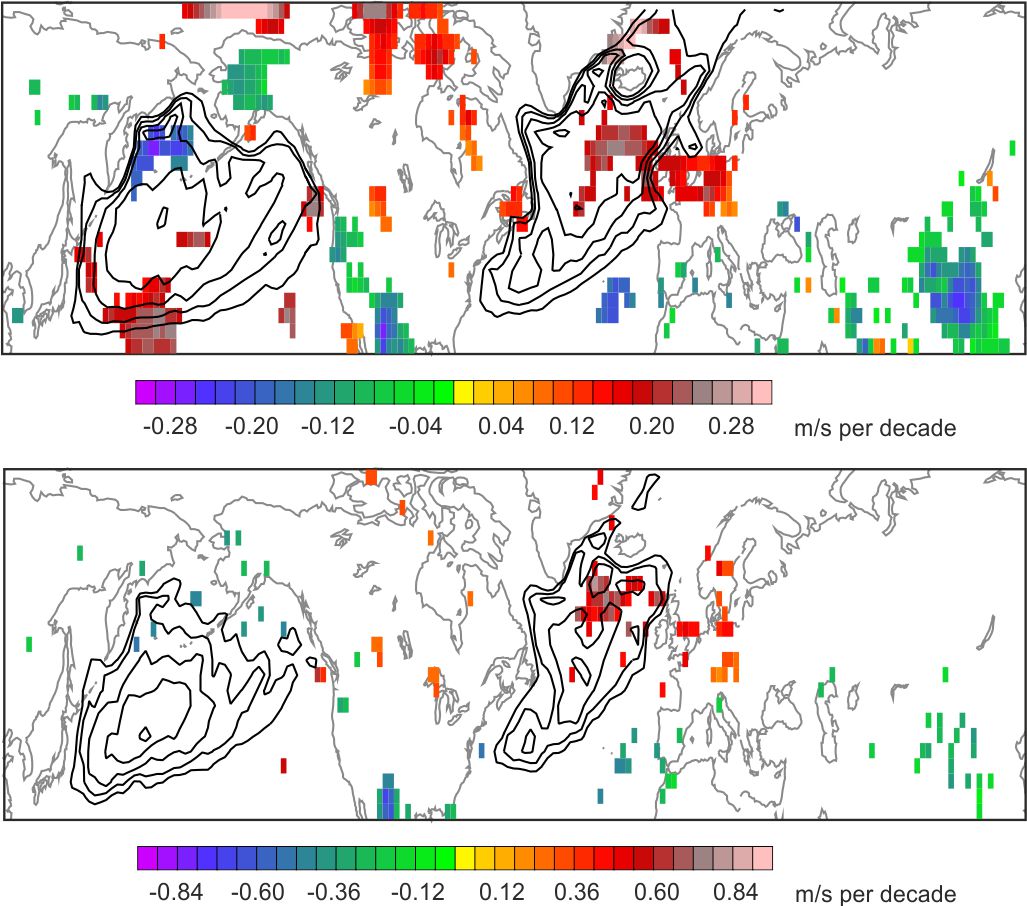
Map of the trend in the annual 98th percentile (top) and annual maximum (bottom) 0.995 sigma level wind from 20CR for the period 1950-2008. Shown is the mean of the trend from the individual members, but only if 90% of the ensemble members exhibit a significant (p<0.05) trend. Contours denote the ensemble average of the 98th percentile and annual maximum 0.995 sigma level wind, respectively, with contours starting at 20 m/s (top) and 30 m/s (bottom) and an interval of 1 m/s.