CFSR

Reanalyses Comparisons: Suggested Practices

Created by Cathy.Smith@noaa.gov on - Updated on 12/20/2021 10:08

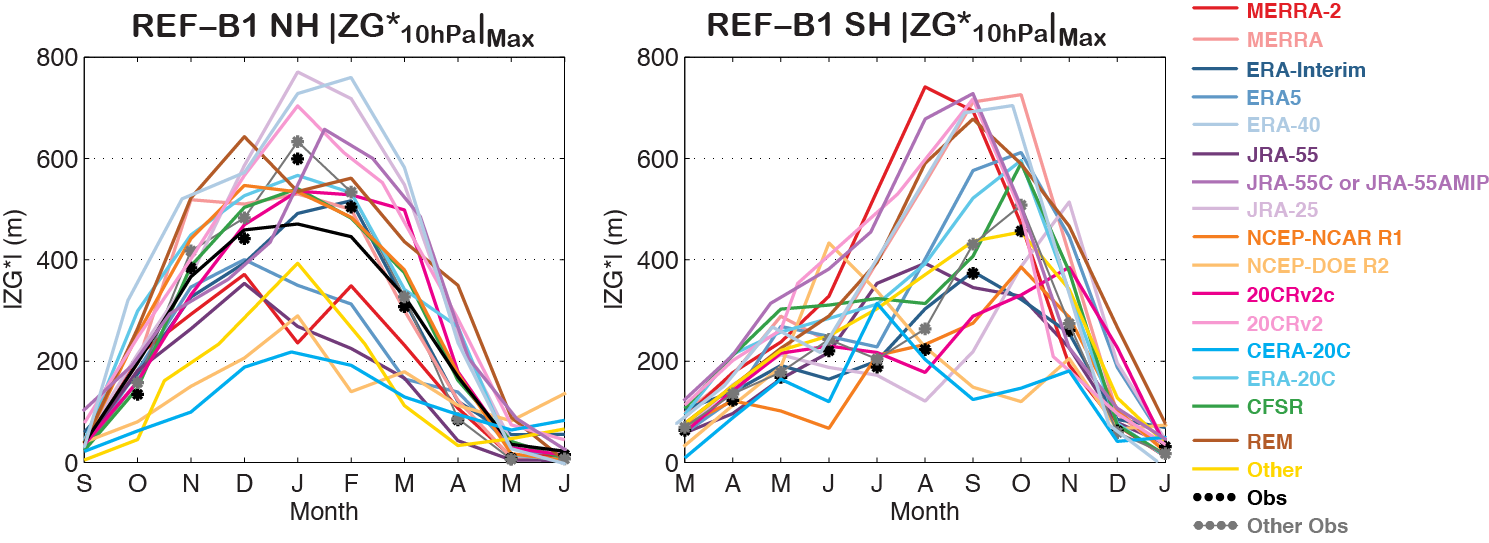
Suggested Colors for Intercomparing Reanalysis Timeseries from S-RIP:


The Sparc Reanalysis Intercomparison Project (S-RIP --> https://s-rip.github.io/) has a suggested list of colors to use for comparing reanalysis time-series. The list can be viewed here https://s-rip.ees.hokudai.ac.jp/mediawiki/index.php/Notes_for_Authors --> https://s-rip.github.io/report/colourdefinition.html The colors are available in CVS format below, in NCL, and in XLS. The link to the S-RIP page has examples for Python and IDL --> https://s-rip.github.io/report/colourtables.html.

Note that the URLs have changed. 

The colors are available in CVS format below, in NCL, and in XLS


CSV:

r,g,b,c,m,y,k,RGB Hexadecimal,reanalysis

226, 31, 38,  0,86.28,83.19,11.37,  E21F26,  MERRA-2

246, 153, 153,  0,37.8,37.8,3.53,  F69999,  MERRA

41, 95, 138,  70.29,31.16,0,45.88,  295F8A,  ERA-Interim

95, 152, 198,  52.02,23.23,0,22.35,  5F98C6,  ERA5

175, 203, 227,  22.91,10.57,0,10.98,  AFCBE3,  ERA-40

114, 59, 122,  6.56,51.64,0,52.16,  723B7A,  JRA-55

173, 113, 181,  4.42,37.57,0,29.02,  AD71B5,  JRA-55C or JRA-55 AMIP

214, 184, 218,  1.83,15.6,0,14.51,  D6B8DA,  JRA-25

245, 126, 32,  0,48.57,86.94,3.92,  F57E20,  NCEP-R1

253, 191, 110,  0,24.51,56.52,0.78,  FDBF6E,  NCEP-R2

236, 0, 140,  0,100,40.68,7.45,  EC008C,  20CRv2c

247, 153, 209,  0,38.06,15.38,3.14,  F799D1,  20CRv2

0, 174, 239,  100,27.2,0,6.27,  00AEEF,  CERA-20C

96, 200, 232,  58.62,13.79,0,9.02,  60C8E8,  ERA-20C

52, 160, 72,  67.5,0,55,37.25,  34A048,  CFSR

179, 91, 40,  0,49.16,77.65,29.8,  B35B28,  REM

255,215,0,  0,15.69,100,0,  FFD700,  Other

0, 0, 0,  0,0,0,100,  000000,  Obs

119, 119, 119,  0,0,0,53.33,  777777,  Other Obs

This image shows how the colors can be used.
SRIP color scale


Suggested Practices: Climatologies:


Use 1981-2010.

ningxin (not verified)

Sun, 11/07/2021 - 21:50

Thanks for your help, I really appreciate your help since I don't have alternative link to get access to the data.

Lyndon Mark Olaguera (not verified)

Sat, 01/26/2019 - 09:42

Dear Sir/Madam,

I hope this message finds you well.

I would like to ask if you have alternative links in downloading the 20CR V1 and 2 reanalysis data sets. With the US Government shutdown, the esrl website does not work.

I'll appreciate any help.
Add new comment

CAPTCHA
This question is for testing whether or not you are a human visitor and to prevent automated spam submissions.

Representation of tropical subseasonal variability of precipitation in global reanalyses

Created by daehyunk on - Updated on 07/18/2016 10:13

From Daehyun Kim, M.-I. Lee, D. Kim, S.D. Schubert, D. E. Waliser, and B. Tian, Clim. Dyn., doi 10. 1007/s00382-013-1890-x. Online First.


     The study examined the representation of tropical subseasonal variability of precipitation in five global reanalyses (RAs) – the three generations of global RAs from NCEP (NCEP/NCAR, NCEP-DOE, and CFSR), and two other RAs from ECMWF (ERA-I) and NASA/GSFC (MERRA). The modern RAs show significant improvement in their representation of the mean state and subseasonal variability of precipitation when compared to the two older NCEP RAs. The modern RAs also show higher coherence of CCEWs with observed variability and more realistic eastward propagation of the MJO precipitation. However, the probability density of rain intensity in the modern RAs shows discrepancies from observations that are similar to what the old RAs have. The study also indicates that the modern RAs exhibit common systematic deficiencies in the variability and the phase relationship of high-frequency CCEWs other than the MJO. The study leaves a detailed analysis of impacts driven by assimilating moisture-related satellite radiances in the modern RAs for further study, which are speculated as at least one of the potential sources for the improvement from the old RAs in the representation of MJO and CCEWs.


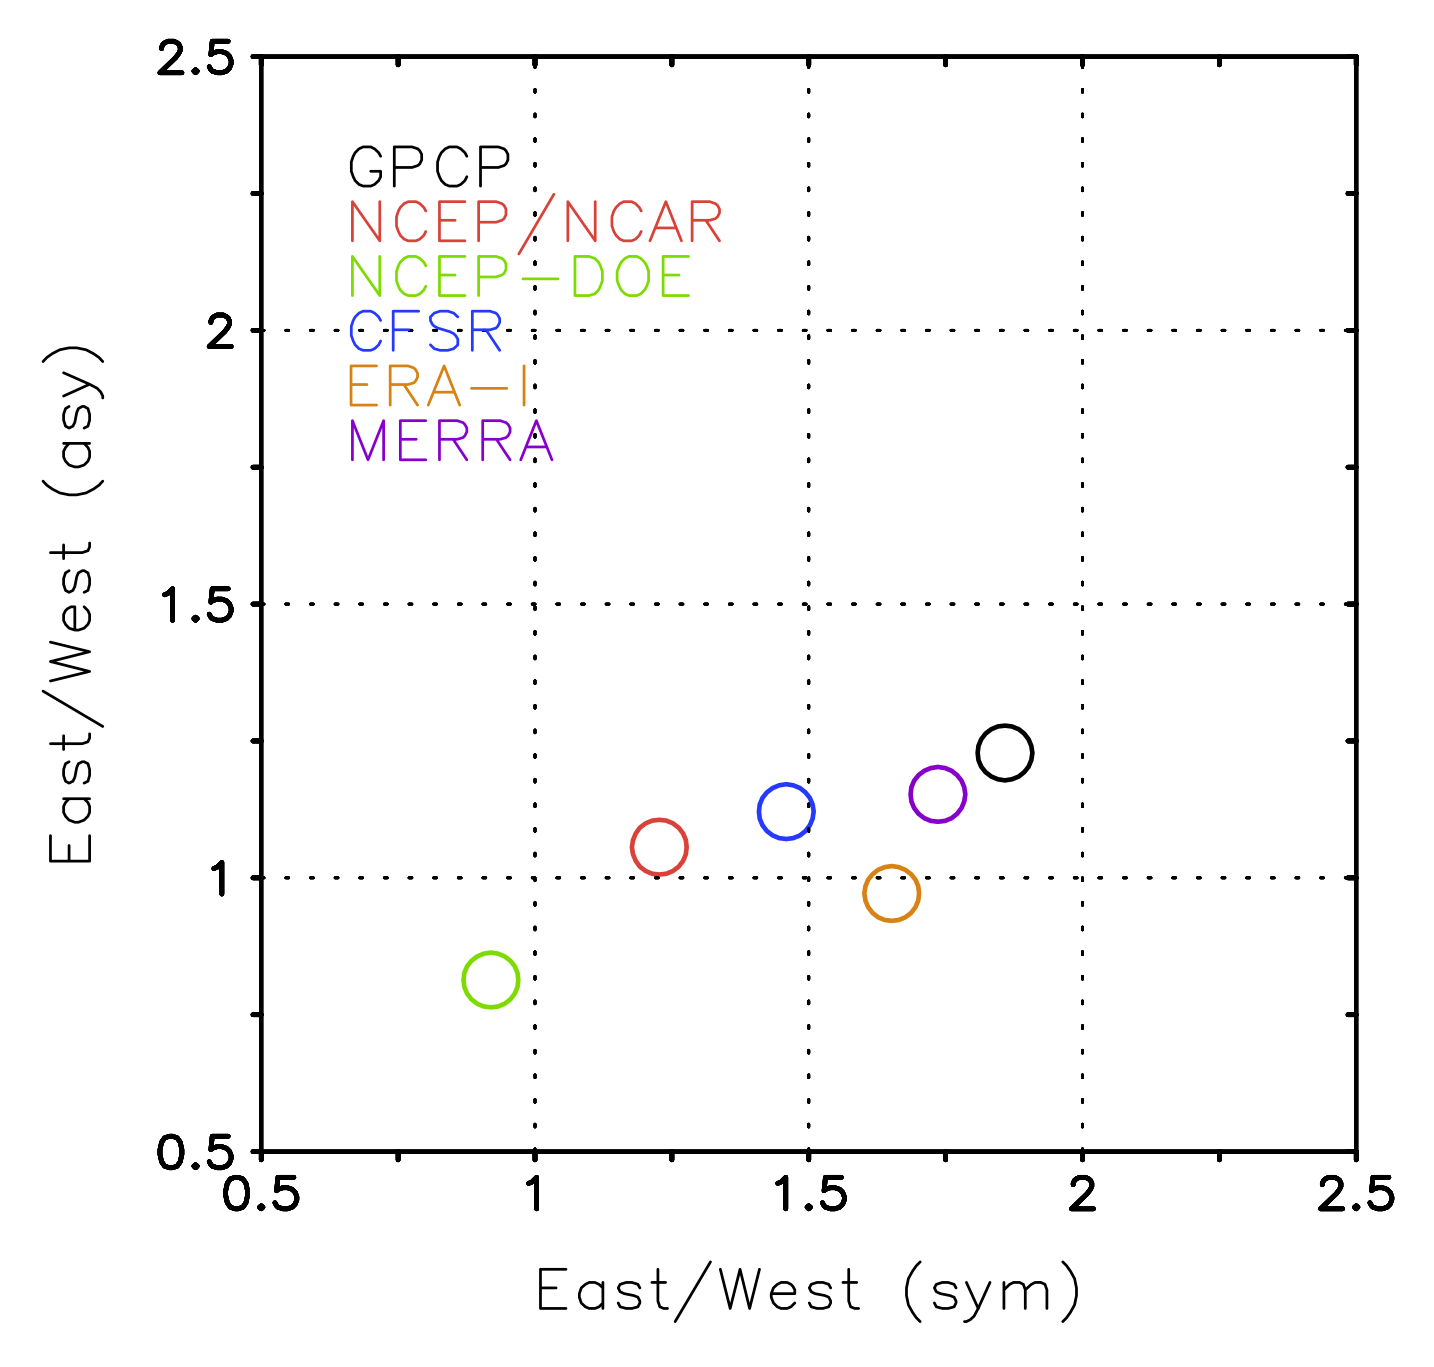
Scatter plot between East/West power ratios of symmetric and antisymmetric MJO. The ratio is defined as the sum of power over the MJO band (wavenumber 1-5, period 30-60 days) divided by that of the westward propagating counterpart.


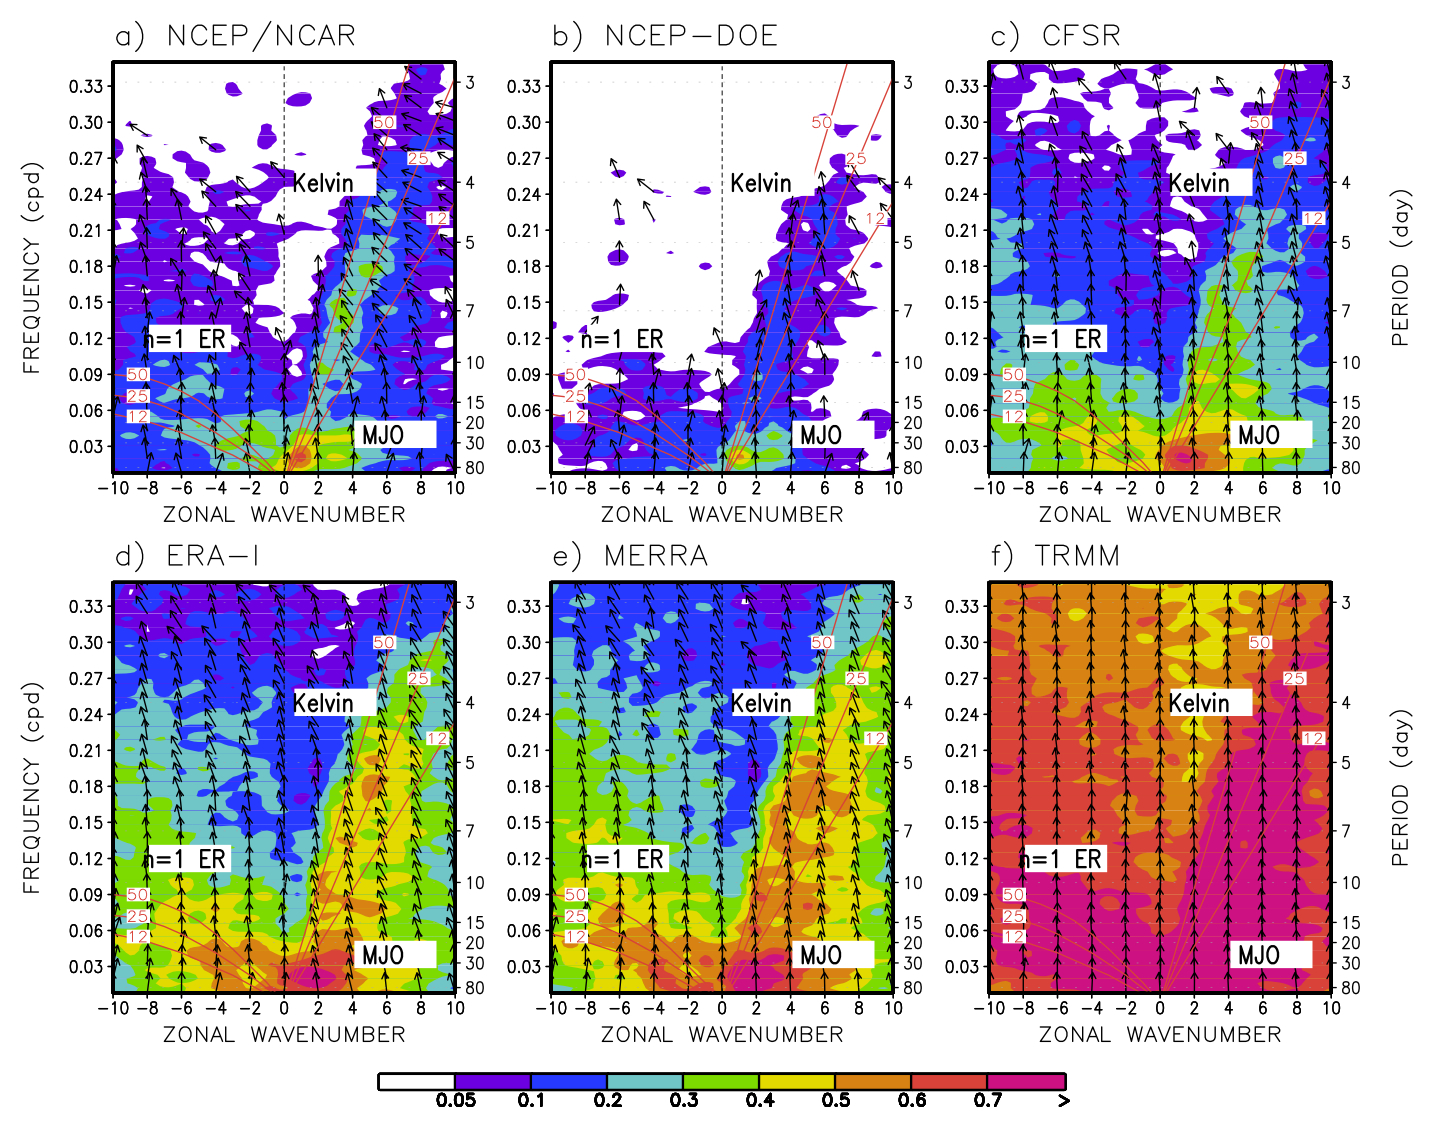
Coherence squared (colors) and phase lag (vectors) between GPCP precipitation and precipitation from a) NCEP/NCAR, b) NCEP-DOE, c) CFSR, d) ERA-I, e) MERRA, and f) TRMM. The symmetric spectrum is shown. Spectra were computed at individual latitude, and then averaged over 15oS–15oN. Vectors represent the phase by which reanalysis precipitation lags GPCP, increasing in the clockwise direction. A phase of 0o is represented by a vector directed upward.

Add new comment

CAPTCHA
This question is for testing whether or not you are a human visitor and to prevent automated spam submissions.

The detection of Atmospheric Rivers in Atmospheric Reanalyses

Created by d.a.lavers on - Updated on 07/18/2016 10:13

Lavers, D.A., G. Villarini, R.P. Allan, E.F. Wood, and A.J. Wade, The detection of atmospheric rivers in atmospheric reanalyses and their links to British winter floods and the large-scale climatic circulation, Journal of Geophysical Research, 117, D20106, doi:10.1029/2012JD018027, 2012.


Atmospheric rivers (ARs) are narrow bands of enhanced water vapor transport in the lower troposphere, and are the cause of extreme precipitation and floods over mid-latitude regions.  This study introduces an algorithm (based on the vertically-integrated horizontal Water Vapor Transport, IVT) for the detection of persistent ARs (lasting 18 hours or longer) in five atmospheric reanalysis products.  The reanalyses considered were: (1) NCEP Climate Forecast System (CFSR), (2) ECMWF ERA-Interim (ERAIN), (3) Twentieth Century Reanalysis (20CR), (4) NASA Modern Era Retrospective-Analysis for Research and Applications (MERRA), and (5) NCEP–NCAR.

Figure 1: Time series of the number of persistent ARs in each winter half-year (October to March) over 1980–2010 in the five reanalyses (left y-axis).  The black dashed line represents the winter half-year Scandinavian Pattern index (anomaly values shown on the right y-axis).  The total number of ARs for each reanalysis product is given in the legend.

Time series of the number of detected ARs in each winter half-year over 1980–2010 in the five reanalyses are shown in Figure 1 (taken from JGR paper).  The number of ARs varies between about 2 and 14 events per winter.  Each product identifies a different number of ARs ranging from 190 in CFSR to 264 in 20CR, which may be partly caused by the different IVT threshold values used for each reanalysis, as well as the different assimilating models and data used. As shown in Figure 1, a negative dependence was found between AR frequency and the winter half-year Scandinavian Pattern. In conclusion, the generally good agreement of AR occurrence between the reanalyses suggests that realistic sea surface temperatures and atmospheric circulation, used in the five products, are sufficient for simulating the AR structures.


Figure 2: The IVT (in kg m-1 s-1) for (a) 20CR, (c) CFSR, (d) ERAIN, (e) MERRA, (f) NCEP–NCAR and (b) 20CR MSLP field (in hPa) at 1200 UTC 10th December 1994 before the largest flood event on 11th December 1994 in the Ayr at Mainholm basin in Scotland.  The “L” and “H” in panel (b) refer to the Low and High pressure centres respectively; the black dots in the panels mark the location of the Ayr at Mainholm basin.

An example of an AR captured in the five reanalyses is shown in Figure 2 (taken from JGR paper); this AR was behind the largest flood in one of the study river basins. The effect of the different reanalysis grid resolutions is shown, with the peak IVT and hence AR region (as shown by the red and orange colors) in the finer resolution CFSR, ERAIN and MERRA products occupying a smaller region than in the 20CR or NCEP-NCAR. 

A strong link exists between the detected ARs and the biggest winter floods in the nine study basins. In one western British basin about 80% of the 31 largest floods followed a persistent AR. As the largest floods in these basins occur in the winter, these results provide evidence that ARs control a large part of the upper tail of the flood peak distribution.   


Add new comment

CAPTCHA
This question is for testing whether or not you are a human visitor and to prevent automated spam submissions.

Tropical intraseasonal rainfall variability in the CFSR

Created by leigh.zhang on - Updated on 07/18/2016 10:13

Wang, J., W. Wang, X. Fu, K.-H. Seo, 2012: Tropical intraseasonal rainfall variability in the CFSR. Climate Dynamics, 38, 2191-2207, http://link.springer.com/article/10.1007/s00382-011-1087-0

While large-scale circulation fields from atmospheric reanalyses have been widely used to study the tropical intraseasonal variability, rainfall variations from the reanalyses are less focused. Because of the sparseness of in situ observations available in the tropics and strong coupling between convection and large-scale circulation, the accuracy of tropical rainfall from the reanalyses not only measures the quality of reanalysis rainfall but is also to some extent indicative of the accuracy of the circulations fields. This study analyzes tropical intraseasonal rainfall variability in the recently completed NCEP Climate Forecast System Reanalysis (CFSR) and its comparison with the widely used NCEP/NCAR reanalysis (R1) and NCEP/DOE reanalysis (R2). The R1 produces too weak rainfall variability while the R2 generates too strong westward propagation. Compared with the R1 and R2, the CFSR produces greatly improved tropical intraseasonal rainfall variability with the dominance of eastward propagation and more realistic amplitude. An analysis of the relationship between rainfall and large-scale fields using composites based on Madden-Julian Oscillation (MJO) events shows that, in all three NCEP reanalyses, the moisture convergence leading the rainfall maximum is near the surface in the western Pacific but is above 925 hPa in the eastern Indian Ocean. However, the CFSR produces the strongest large-scale convergence and the rainfall from CFSR lags the column integrated precipitable water by 1 or 2 days while R1 and R2 rainfall tends to lead the respective precipitable water. Diabatic heating related to the MJO variability in the CFSR is analyzed and compared with that derived from large-scale fields. It is found that the amplitude of CFSR-produced total heating anomalies is smaller than that of the derived. Rainfall variability from the other two recently produced reanalyses, the ECMWF Re-Analysis Interim (ERAI), and the Modern Era Retrospective-analysis for Research and Applications (MERRA), is also analyzed. It is shown that both the ERAI and MERRA generate stronger rainfall spectra than the R1 and more realistic dominance of eastward propagating variance than R2. The intraseasonal variability in the MERRA is stronger than that in the ERAI but weaker than that in the CFSR and CMORPH.

/static-content/0.5898/images/970/art%253A10.1007%252Fs00382-011-1087-0/MediaObjects/382_2011_1087_Fig1_HTML.gif

Wavenumber-frequency spectra of 10ºS–10ºN average of raw daily–mean anomalies of precipitation. a CMORPH; b R1; c R2; and d CFSR The unit is 0.001 mm2 days−2. Contours are shaded starting at 6 with an interval of 3.

/static-content/0.5898/images/970/art%253A10.1007%252Fs00382-011-1087-0/MediaObjects/382_2011_1087_Fig12_HTML.gif

Wavenumber-frequency spectra of 10ºS–10ºN average of raw daily–mean anomalies of precipitation. a ERAI; and b MERRA. 


Add new comment

CAPTCHA
This question is for testing whether or not you are a human visitor and to prevent automated spam submissions.

The surface climate in the NCEP CFSR

Created by leigh.zhang on - Updated on 07/18/2016 10:13

Wang, W., P. Xie, S.-H. Yoo, Y. Xue, A. Kumar and X. Wu, 2011:  An assessment of the surface climate in the NCEP climate forecast system reanalysis. Climate Dynamics, 37, 1601-1620

http://link.springer.com/article/10.1007%2Fs00382-010-0935-7

This paper analyzes surface climate variability in the climate forecast system reanalysis (CFSR) recently completed at the National Centers for Environmental Prediction (NCEP). The CFSR represents a new generation of reanalysis effort with first guess from a coupled atmosphere–ocean–sea ice–land forecast system. This study focuses on the analysis of climate variability for a set of surface variables including precipitation, surface air 2-m temperature (T2m), and surface heat fluxes. None of these quantities are assimilated directly and thus an assessment of their variability provides an independent measure of the accuracy. The CFSR is compared with observational estimates and three previous reanalyses (the NCEP/NCAR reanalysis or R1, the NCEP/DOE reanalysis or R2, and the ERA40 produced by the European Centre for Medium-Range Weather Forecasts). The CFSR has improved time-mean precipitation distribution over various regions compared to the three previous reanalyses, leading to a better representation of freshwater flux (evaporation minus precipitation). For interannual variability, the CFSR shows improved precipitation correlation with observations over the Indian Ocean, Maritime Continent, and western Pacific. The T2m of the CFSR is superior to R1 and R2 with more realistic interannual variability and long-term trend. On the other hand, the CFSR overestimates downward solar radiation flux over the tropical Western Hemisphere warm pool, consistent with a negative cloudiness bias and a positive sea surface temperature bias. Meanwhile, the evaporative latent heat flux in CFSR appears to be larger than other observational estimates over most of the globe. A few deficiencies in the long-term variations are identified in the CFSR. Firstly, dramatic changes are found around 1998–2001 in the global average of a number of variables, possibly related to the changes in the assimilated satellite observations. Secondly, the use of multiple streams for the CFSR induces spurious jumps in soil moisture between adjacent streams. Thirdly, there is an inconsistency in long-term sea ice extent variations over the Arctic regions between the CFSR and other observations with the CFSR showing smaller sea ice extent before 1997 and larger extent starting in 1997. These deficiencies may have impacts on the application of the CFSR for climate diagnoses and predictions. Relationships between surface heat fluxes and SST tendency and between SST and precipitation are analyzed and compared with observational estimates and other reanalyses. Global mean fields of surface heat and water fluxes together with radiation fluxes at the top of the atmosphere are documented and presented over the entire globe, and for the ocean and land separately.

Precipitation climatology (contour) and differences (shading) from the observation taken as the average of CMAP and GPCP. a Observation, b R1, c R2, d ERA40, and e CFSR. Contours are plotted at 2, 4, 8, and 12 mm/day, and shadings are at −4, −2, −1, −0.5, 0.5, 1, 2, and 4 mm/day. Global mean (GM) climatology is shown above each panel


Add new comment

CAPTCHA
This question is for testing whether or not you are a human visitor and to prevent automated spam submissions.

Assessing the performance of the CFSR by an ensemble of analyses

Created by leigh.zhang on - Updated on 07/18/2016 10:13

Ebisuzaki, W. and L. Zhang, 2011: Assessing the performance of the CFSR by an ensemble of analyses. Climate Dynamics, 37, 2541-2550

http://link.springer.com/article/10.1007/s00382-011-1074-5#

The Climate Forecast System Reanalysis (CFSR, Saha et al. in Bull Am Meteor Soc 91:1015–1057, 2010) is the latest global reanalysis from the National Centers of Environmental Prediction (NCEP). In this study, we compare the CFSR tropospheric analyses to two ensembles of analyses. The first ensemble consists of 12 h analyses from various operational analyses for the year 2007. This ensemble shows how well the CFSR analyses can capture the daily variability. The second ensemble consists of monthly means from the available reanalyses from the years 1979 to 2009 which is used to examine the trends. With the 2007 ensemble, we find that the CFSR captures the daily variability in 2007 better than the older reanalyses and is comparable to the operational analyses. With the ensemble of monthly means, the CFSR is often the outlier. The CFSR shows a strong warming trend in the tropics which is not seen in the observations or other reanalyses.


The 200 hPa height (m) for Singapore (grid cell average). The time series were low passed filtered by a 12 months running mean. Shown are CFSR (red), ERA-40 (orange), JRA-25 (light blue), MERRA (green), R1 (blue), R2 (black) and the observation (thick black line).


Add new comment

CAPTCHA
This question is for testing whether or not you are a human visitor and to prevent automated spam submissions.

SST-Precipitation relationship

Created by leigh.zhang on - Updated on 07/18/2016 10:13

Kumar, A., L. Zhang and W. Wang, 2012: Sea Surface Temperature - Precipitation Relationship in Different Reanalyses. Monthly Weather Review, doi: http://dx.doi.org/10.1175/MWR-D-12-00214.1

The focus of this investigation is how the relationship at intraseasonal time scales between sea surface temperature (SST) and precipitation (SST-P) varies among different reanalyses. The motivation for this work was spurred by a recent report that documented that the SST-P relationship in Climate Forecast System Reanalysis (CFSR) was much closer to that in the observation than it was for the older generation of reanalysis – NCEP/NCAR reanalysis (R1) and NCEP/DOE reanalysis (R2). Further, the reason was attributed either to the fact that the CFSR is a partially coupled reanalysis, while R1 and R2 are atmospheric alone reanalyses, or that R1 and R2 use the observed weekly averaged SST.

The authors repeated the comparison of the SST-P relationship among R1, R2, and CFSR, as well as two recent generation of atmosphere alone reanalyses, the Modern Era-Retrospective-analysis for Research and Applications (MERRA) and the ECMWF Re-Analysis Interim (ERAI). The results clearly demonstrate that the differences in SST-P relationship at intraseasonal time scales across different reanalyses are not due to whether the reanalysis system is coupled or atmosphere alone, but are due to the specification of different SSTs. SST-P relationship in different reanalyses, when computed against a single SST for the benchmark, demonstrates a relationship that is common across all the reanalyses and observations.

Lead-lag SST-precipitation correlation for various reanalyses and for observations over the tropical western Pacific (averaged over 10°S–10°N, 130°–150°E) for respective SSTs were used (left panel), and for NCDC SST as the benchmark (right panel). Negative (positive) lag in days on the x axis indicates days by which the SST leads (lags) the precipitation.

Add new comment

CAPTCHA
This question is for testing whether or not you are a human visitor and to prevent automated spam submissions.

Interannual Variability in Reanalyses

Created by hpaek on - Updated on 08/09/2016 11:32

Paek, H. and H.-P. Huang (2012), A comparison of the interannual variability in atmospheric angular momentum and length-of-day using multiple reanalysis data sets, J. Geophys. Res., 117, D20102, doi:10.1029/2012JD018105

This study performs an intercomparison of the interannual variability of atmospheric angular momentum (AAM) in eight reanalysis datasets for the post-1979 era.  The AAM data are further cross validated with the independent observation of length-of-day (LOD). The intercomparison reveals a close agreement among almost all reanalysis datasets, except that the AAM computed from the 20th Century Reanalysis (20CR) has a noticeably lower correlation with LOD and with the AAM from other datasets.  This reduced correlation is related to the absence of coherent low-frequency variability, notably the Quasi-biennial Oscillation, in the stratospheric zonal wind in 20CR.  If the upper-level zonal wind in 20CR is replaced by its counterpart from a different reanalysis dataset, a higher value of the correlation is restored.  The correlation between the AAM and the Nino3.4 index of tropical Pacific SST is also computed for the reanalysis datasets. In this case, a close agreement is found among all, including 20CR, datasets. This indicates that the upward influence of SST on the tropospheric circulation is well captured by the data assimilation system of 20CR, which only explicitly incorporated the surface observations.  This study demonstrates the overall close agreement in the interannual variability of AAM among the reanalysis datasets.  This finding also reinforces the view expressed in a recent work by the authors that the most significant discrepancies among the reanalysis datasets are in the long-term mean and long-term trend. Paek and Huang 2012

   The time series of ∆LOD (red curve, converted to an equivalent ∆AAM using Eq. (3)) and ∆AAM (blue curve) from different reanalysis datasets: (a) NCEP R-1, (b) NCEP R-2, (c) CFSR, (d) 20CR, (e) ERA-40, (f) ERA-Interim, (g) JRA-25, and (h) MERRA. The time series of ∆Nino3.4 from HadISST is imposed as the green curve in panel (h). The units for ∆AAM and ∆Nino3.4 are 1025 kg m2 s-1 and 1 °C, respectively. The time series for ∆AAM in panel (e) is slightly shorter due to the shorter record of the ERA-40 dataset.

   The time series of ∆MR,STRAT for four selected reanalysis datasets including 20CR. (b) The original (dark blue) and the modified ∆AAM (light blue) for 20CR. The modified ∆AAM is calculated by replacing the zonal wind in the stratosphere by that from NCEP R-1. See text for detail.  The time series of ∆LOD (converted to an equivalent ∆AAM) is also shown as the red curve. The unit for ∆AAM is 1025 kg m2 s-1.

Add new comment

CAPTCHA
This question is for testing whether or not you are a human visitor and to prevent automated spam submissions.

Report of the 4th World Climate Research Programme International Conference on Reanalyses Discussion Page

Created by gilbert.p.comp… on - Updated on 08/09/2016 11:45
Michael G. Bosilovich NASA/GSFC/GMAO
Michel Rixen, WCRP
Peter van Oevelen, IGPO
Ghassem Asrar, WCRP
Gilbert Compo, NOAA/ESRL
Kazutoshi Onogi, JMA
Adrian Simmons, ECMWF
Kevin Trenberth, NCAR
Dave Behringer, NOAA/NCEP/EMC
Tanvir Hossain Bhuiyan, University of Louisville
Shannon Capps, Georgia Institute of Technology
Ayan Chaudhuri, Atmospheric and Environmental Research, Inc.
Junye Chen, ESSIC NASA/GMAO U. Maryland
Linling Chen, Nansen Environmental and Remote Sensing Center, Norway
Nicole Colasacco-Thumm, University of Wisconsin-Madison
Ma.Gabriela Escobar, Escuela Superior Politécnica del Litoral
Craig R. Ferguson, University of Tokyo
Toshiyuki Ishibashi, JMA IRI
Margarida L. R. Liberato, University of Lisbon
Jesse Meng, NOAA/NCEP/EMC
Andrea Molod, NASA/GMAO/USRA
Paul Poli, ECMWF
Joshua Roundy, Princeton University
Kate Willett, Met Office Hadley Centre
Jack Woollen, IMSG/NOAA/NCEP
Rongqian Yang, NOAA/NCEP/EMC

1. Executive Summary

Reanalyses have become an integral part of Earth system science research across many disciplines. While originating in the atmospheric sciences and Numerical Weather Prediction (NWP), the essential methodology has been adopted in the fields of oceanography and terrestrial ecosystems and hydrology, with emerging research in atmospheric composition, cryosphere and carbon cycle disciplines. Major challenges lie ahead as the disparate nature of each discipline become joined in Earth system analyses. Clearly, substantial progress has been made since the last reanalysis conference (Jan 2008, Tokyo Japan). Newer atmospheric reanalyses (MERRA, CFSR and ERA-Interim) have been evaluated in depth, and many strengths and weaknesses identified. Early results from JRA-55 are becoming available. There is tremendous potential in the NOAA/ESRL 20CR surface data only reanalysis, and in the uncertainty provided from the ensemble. Ensembles of multiple reanalysis systems can provide valuable information. Although there are several reanalyses efforts worldwide at present, the community consensus is that the diversity among them will enable deeper understanding of the reanalyses systems, their strengths and weaknesses and their representation of the underlying earth system processes/phenomena. This is then reflected in the producers’ plans (notably those of JMA and ECMWF) leaning toward “families” of reanalyses (each system producing various configurations of reanalysis). There is much to be learned about the observations, data assimilation, modelling, and coupling the Earth system but new data systems, efficient computing and processing of the multitude of reanalyses products are urgently needed. The integrating nature of reanalyses across components of the Earth system (land, ocean atmosphere) is a key benefit, but to date very few reanalyses systems include all relevant data and assimilate all Earth system components. Observations are the fundamental resource for reanalysis. The need for long-term records of continuous measurements cannot be overstated. Data recovery efforts for in situ and remotely sensed observations are essential to extend the records as far back in time as possible to support long historical reanalyses, while concerted efforts to maintain and develop the observing system forward in time to ensure continuity for the future. Documenting the observations and their uses in past reanalyses can be beneficial both to use in future reanalyses and to understanding of the observations. Expertise for all the observations exists around the world, and so, international coordination of observations for reanalysis should be an imperative for international observations and research coordination programs such as GCOS, GEOSS, CEOS and WCRP. Confronting models with observations continues to be important but also confronting models (e.g. ocean and atmospheric models) and observations (e.g. discrepancies between micro-wave satellite records and radiosonde measurements) among themselves are equally important research tasks for the future. Data assimilation methods continue to improve, but have more challenges ahead, such as the amelioration of shocks associated with changes to the observing system (also better characterizing and reducing model bias) and developing uncertainty estimates for reanalyses. Reanalyses have recently been getting attention from the climate monitoring community, and so, their strengths, weaknesses and uncertainty are increasingly exposed.

Reanalysis users often ask which reanalysis is best for a given topic. As newer reanalyses come along, the answer may not be widely known, if at all. In this regard, the community of users and developers must collaborate, given the diversity of applications. The web site, reanalysis.org, has been promoted as an open media for conveying the latest understanding of reanalyses data. Additionally, NCAR’s Climate Data Guide (https://climatedataguide.ucar.edu/) is a very useful go-to source for scientifically sound information and advice on the strengths, limitations and applications of climate data, including reanalyses. While fundamental information is available primarily on atmosphere and ocean reanalyses, discussions on the latest research and understanding are progressing more slowly. Ultimately, it is incumbent on the researchers to assess the multitude of reanalyses objectively. New data systems are required that allow for more efficient cross comparisons among the various reanalyses (such as those used for AMIP and CMIP studies and the Earth System Grid, ESG). The 4th WCRP International Conference on Reanalyses produced excellent discussions across all the important issues in reanalyses, but continuing the progress and improvements will require sustained efforts over the long term. While progress has been made across the major aspects of reanalyses, significant limitations persist. The conference has identified broad directions to continue the advancement of reanalysis:

1) Quantitative Uncertainty – Reanalyses are based on observations, and can include the errors of observations and the assimilating system. It is recommended to have reanalysis data available in a common framework so as to facilitate the analysis of their strengths and weaknesses. The notion of Families of reanalyses will likewise expose the impact of assimilating observations on the analyses. Ensemble methods can also provide quantitative uncertainty estimates. Lastly, passing observations and innovations into an easily accessible data format can promote deeper investigation of the use of observations in the reanalyses.

2) Qualitative Uncertainty – Often researchers inquire to the applicability of a reanalysis for a given phenomena, or even, which reanalysis is best. Often, this is not satisfactorily known, varies with application and requires significant time and research. Therefore, sharing reanalysis knowledge and research in a timely manner, among researchers and developers is a critical need to allow subsequent exploitation by the climate community. The reanalysis.org effort has provided an initial effort along these lines, but more participation is encouraged. In addition, http://climatedataguide.ucar.edu provides informed commentary on analysis and other datasets. Likely, even more lines of communications are required. 

3) Earth System Coupling – The natural course of reanalysis development is toward, longer data sets with coupled Earth system components that will ultimately contribute to improved coupled predictions. The use of more varied observations (e.g. aerosols) will reinforce the physical representation of the Earth system processes in the reanalysis systems. There is a need to develop independent and innovative modeling, coupling and data assimilation methods to represent the Earth System throughout the time span of the observational record. More interdisciplinary collaborations in the system development and observational research will begin to address this need. 

4) Reanalyses, Observations and Stewardship – While the observational records have been greatly improved since the first reanalyses through research, reprocessing and homogenizations, research and improvements continue their development. Reprocessing and intercalibrations of observed records are critical to improve the quality and consistency of reanalyses. In situ and satellite data need to be found, rescued and archived into suitable formats to extend the reanalysis record back in time. Reanalysis systems for the atmosphere, ocean, cryosphere, land, and coupled earth system are needed that maximize use of the observations as far back as each instrumental record will allow. It is important for the observational data and reanalysis developers to maintain communication, so the latest data are used in reanalyses, and also that output of reanalyses may contribute to the understanding of observations. Such an endeavor should be coordinated at an international level.

 Link to Full Report

Add new comment

CAPTCHA
This question is for testing whether or not you are a human visitor and to prevent automated spam submissions.

Evaluation of Southern African precipitation in reanalyses

Created by qiong on - Updated on 08/09/2016 11:45

Zhang, Q., H. Körnich and K. Holmgren, 2012: How well do reanalyses represent the southern African precipitation? Clim. Dyn., DOI: 10.1007/s00382-012-1423-z.

http://dx.doi.org/10.1007/s00382-012-1423-z

Monthly-mean precipitation observations over southern Africa are used to evaluate the performance of eight global reanalyses: ERA-40, ERA-interim, JRA-25, MERRA, CFSR, NCEP-R1, NCEP-R2 and 20CRv2. All eight reanalyses reproduce the regionally averaged seasonal cycle fairly well; a few spatial mismatches with the observations are found in the climate mean for the rainy season. Principal component analyses show a dipole in the leading modes of all reanalyses, however with crucial differences in its spatial position.

Possible reasons for the differences between the reanalyses are discussed on the basis of the ERA-interim and 20CRv2 results. A comparison between the moisture transports shows that ERA-interim manifests a very strong moisture convergence over the eastern equatorial Atlantic, resulting in the strong precipitation here. This excessive convergence may be due to the water–vapor assimilation and convection parameterization. Over the Indian Ocean, the ITCZ is shifted northward in ERA-interim compared to its position in 20CRv2. This discrepancy is most likely attributable to the meridional SST gradients in the Indian Ocean which are significantly larger in the ERA-interim than those in the 20CRv2, and the resulting atmospheric response prevents a southward shift of the ITCZ.

Overall, the consistent description of the dynamical circulation of the atmosphere and the hydrological cycle appears as a crucial benchmark for reanalysis data. Based on our evaluation, the preferential reanalysis for investigating the climate variability over southern Africa is 20CRv2 that furthermore spans the longest time period, hence permitting the most precise investigations of interannual to decadal variability.


Add new comment

CAPTCHA
This question is for testing whether or not you are a human visitor and to prevent automated spam submissions.