Brönnimann, S., A.N. Grant, G.P. Compo,T. Ewen, T. Griesser, A.M. Fischer, M. Schraner, and A. Stickler, 2012: A multi-data set comparison of the vertical structure of temperature variability and change over the Arctic during the past 100 years. Cli. Dyn., 39, 1577-1598, doi:10.1007/s00382-012-1291-6.
We compare the daily, interannual, and decadal variability and trends in the thermal structure of the Arctic troposphere using eight observation-based, vertically resolved data sets, four of which have data prior to 1948. Comparisons on the daily scale between historical reanalysis data and historical upper-air observations were performed for Svalbard for the cold winters 1911/1912 and 1988/89, the warm winters 1944/1945 and 2005/2006, and the International Geophysical Year 1957/58. Excellent agreement is found at mid-tropospheric levels. Near the ground and at the tropopause level, however, systematic differences are identified. On the interannual time scale, the correlations between all data sets are high, but there are systematic biases in terms of absolute values as well as discrepancies in the magnitude of the variability. The causes of these differences are discussed. While none of the data sets individually may be suitable for trend analysis, consistent features can be identified from analyzing all data sets together. To illustrate this, we examine trends and 20-yr averages for those regions and seasons that exhibit large sea-ice changes and have enough data for comparison. In the summertime Pacific Arctic and the autumn eastern Canadian Arctic, the lower tropospheric temperature anomalies for the recent two decades are higher than in any previous 20-yr period. In contrast, mid-tropospheric temperatures of the European Arctic in the wintertime of the 1920s and 1930s may have reached values as high as those of the late 20th and early 21st centuries.
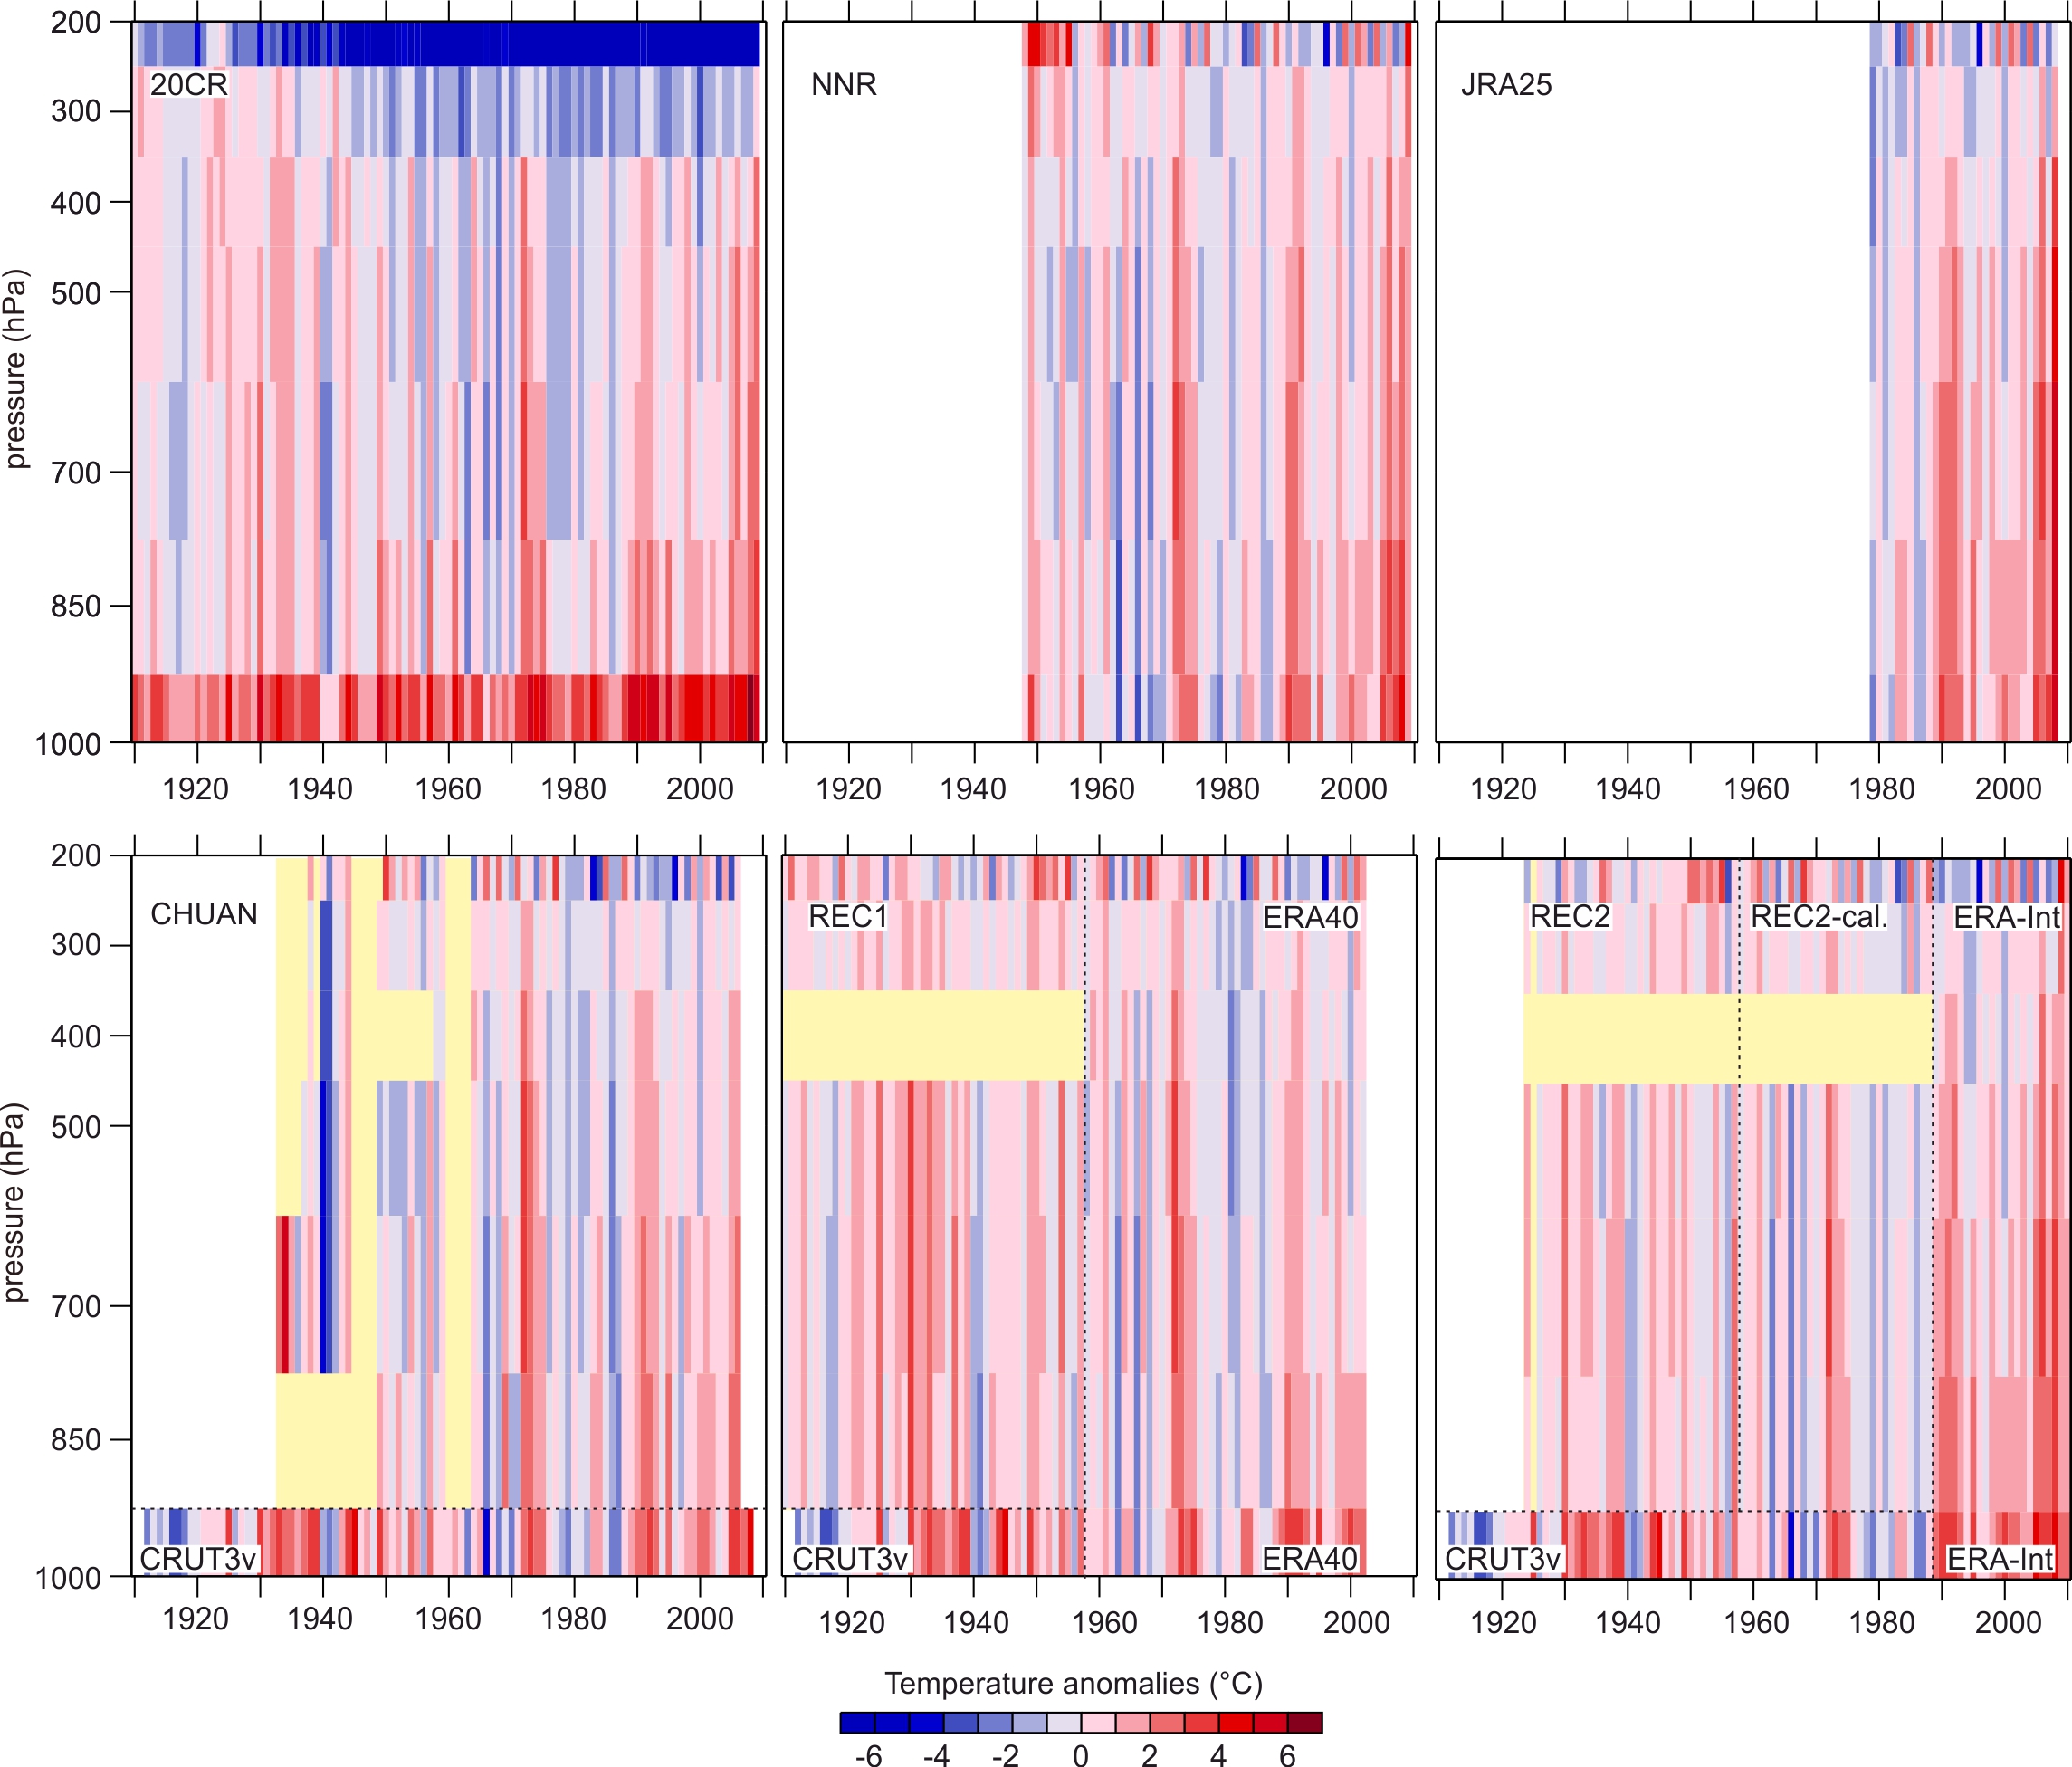
Time-height cross-section of seasonal mean temperature anomalies as a function of pressure and time for different data sets for the European Arctic (see Fig. 2) in winter. All anomalies are with respect to NNR (1961-1990) except CRUTEM3v (self-climatology, see Brohan et al. 2006). Note that for visualisation purposes, non-overlapping data sets have been combined in some cases, indicated by dashed lines). Between the end of the reconstruction period of REC2 (1957) and the start of ERA-Interim (1989) we show the calibration period of REC2. Yellow colours denote missing values.

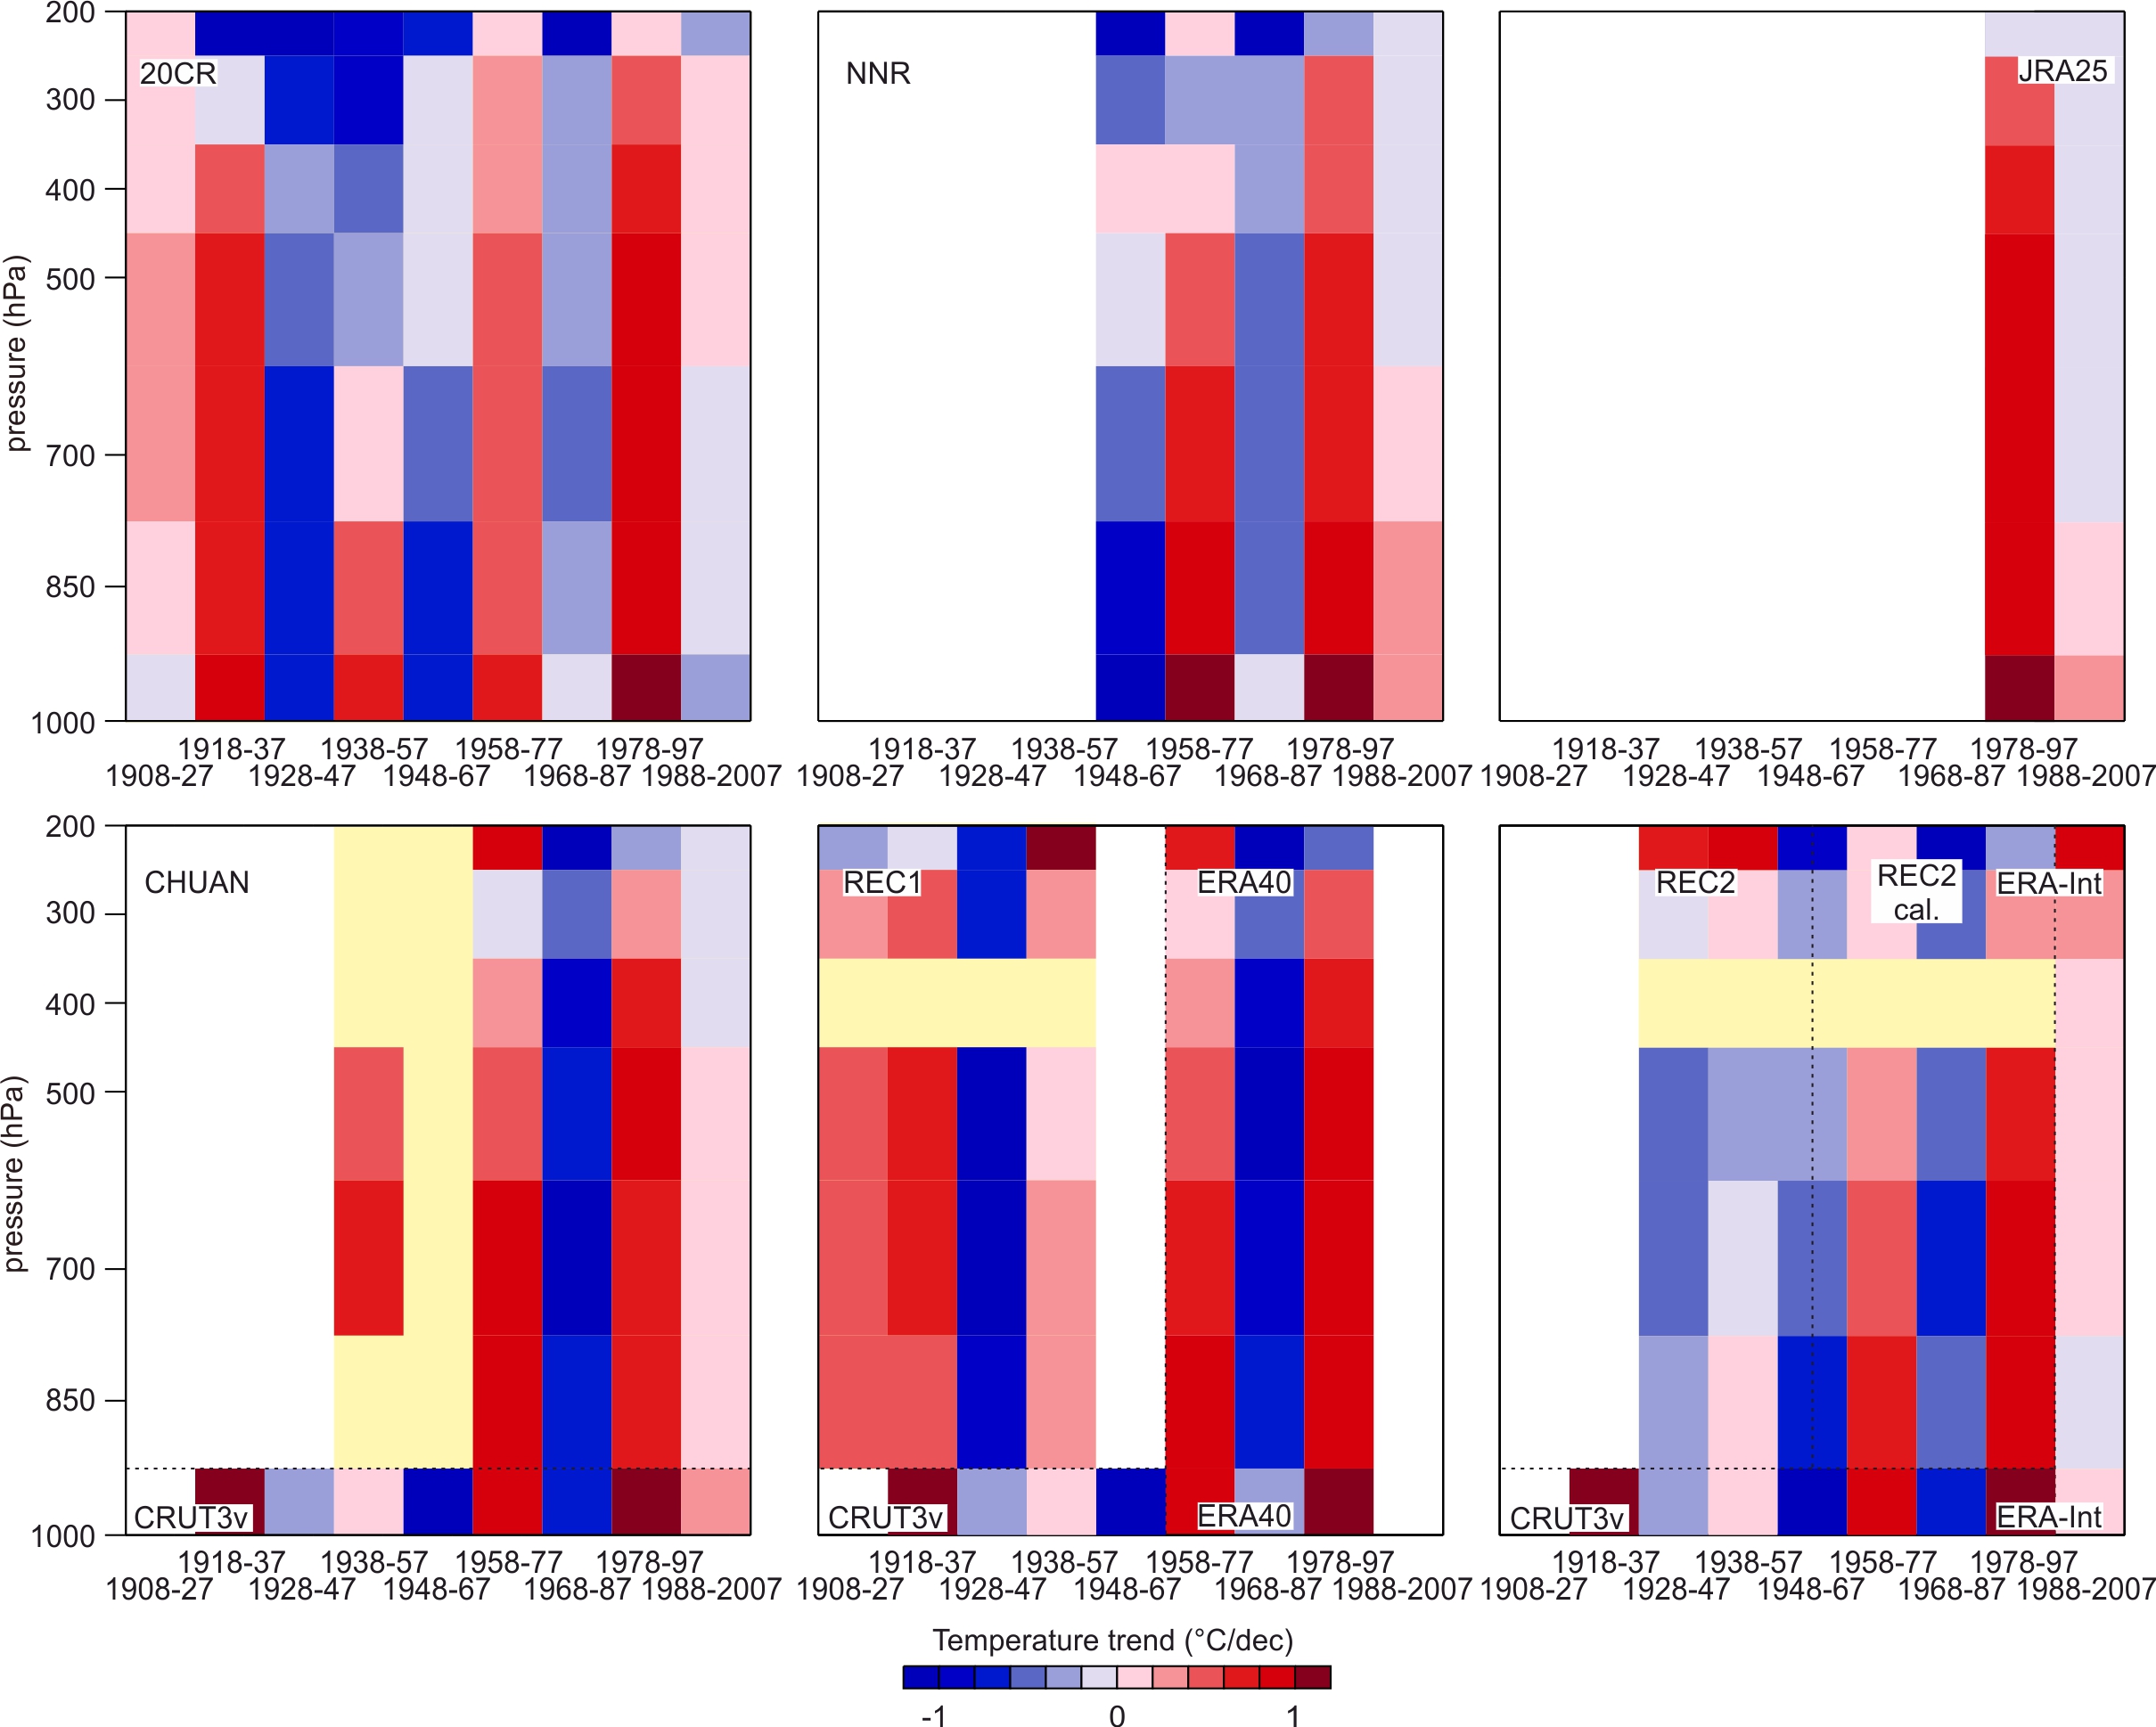
Trend in seasonally-averaged temperature profiles over 20-yr periods as a function of pressure and time period for different data sets for the European Arctic (see Fig. 2) in winter. Note that for visualisation purposes, non-overlapping data sets have been combined in some cases, indicated by dashed lines). Between the end of the reconstruction period of REC2 (1957) and the start of ERA-Interim (1989) we show the calibration period of REC2. Yellow colours denote missing values.
