Pressure observations from ships are known to be biased low by about 5hPa in the 1850s - I've been looking into this. I've made an hourly MSLP climatology from 20CR2c over 1981-2010, and for every C19 observation in ICOADS3b4 with good data (has all of date, location, SLP & AT) I've calculated the observed anomaly to this climatology. Averaging those by year gives the graph below.
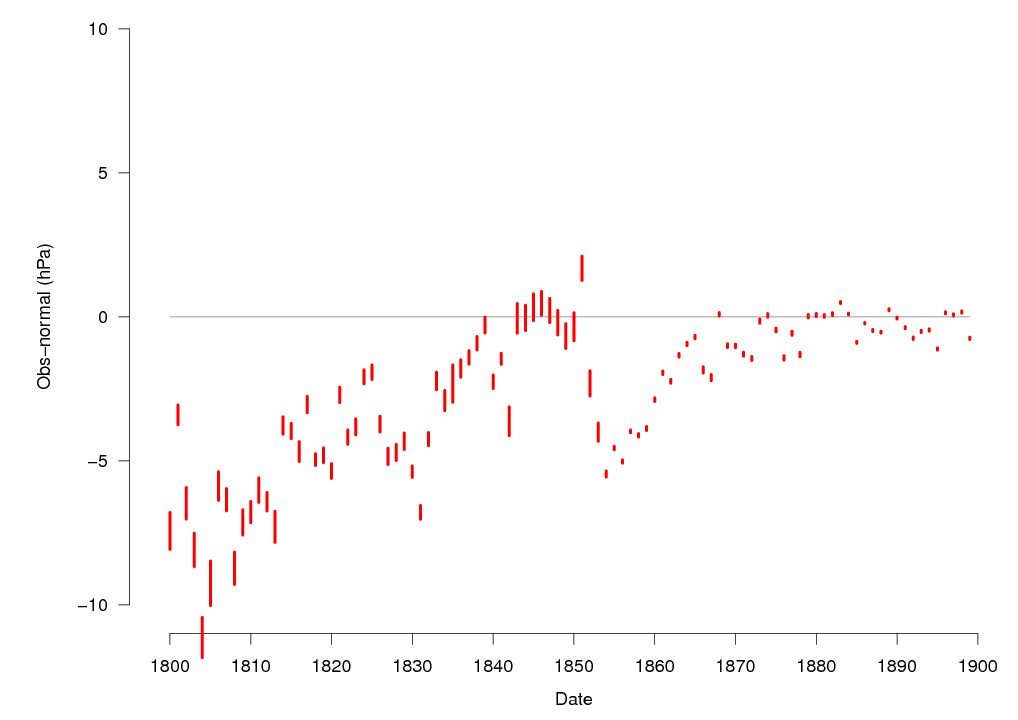
Annual average mean SLP bias in ICOADS3 beta 4 observations (mean +- 2 standard errors)
ICOADS is divided into decks (different observation sources). Calculating the mean bias for each deck with pre-1870 observations shows the dominant contributions are from Decks 248 (English East India ships), 701 (US Maury), and 721 (German Maury), and the time variation split by deck persuaded me to concentrate on deck 721 in the first instance, as that's important (lots of obs., relatively late in the period) and has a relatively homogeneous bias.
If the bias depends on the environment - if it's a mis-applied temperature or gravity correction, or caused by movement of the barometer for example - I'd expect it to vary in some systematic fashion with the latitude of the observation: it doesn't.
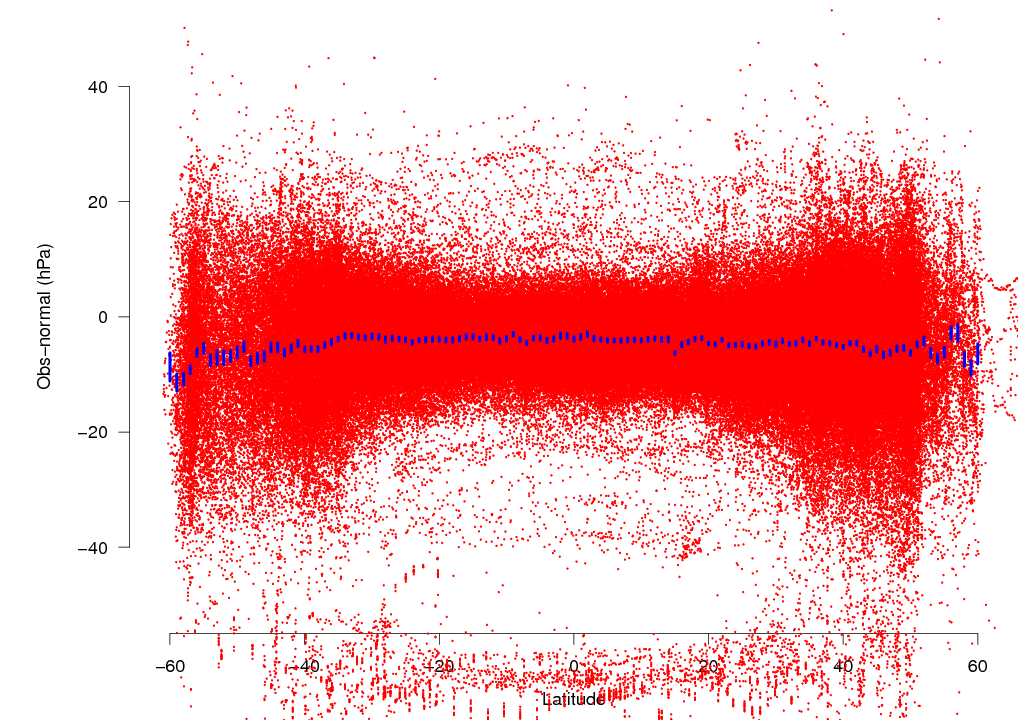
SLP bias in pre-1870 deck 721 observations as a function of observation latitude (red dots). Mean +- 2 standard errors of the bias in each 1 degree latitude band (blue lines).
The mean bias does not co-vary systematically with latitude, or with any parameter that itself co-varies with latitude (so not temperature, pressure, storminess, gravity, ...). It does, however, vary substantially between ships:
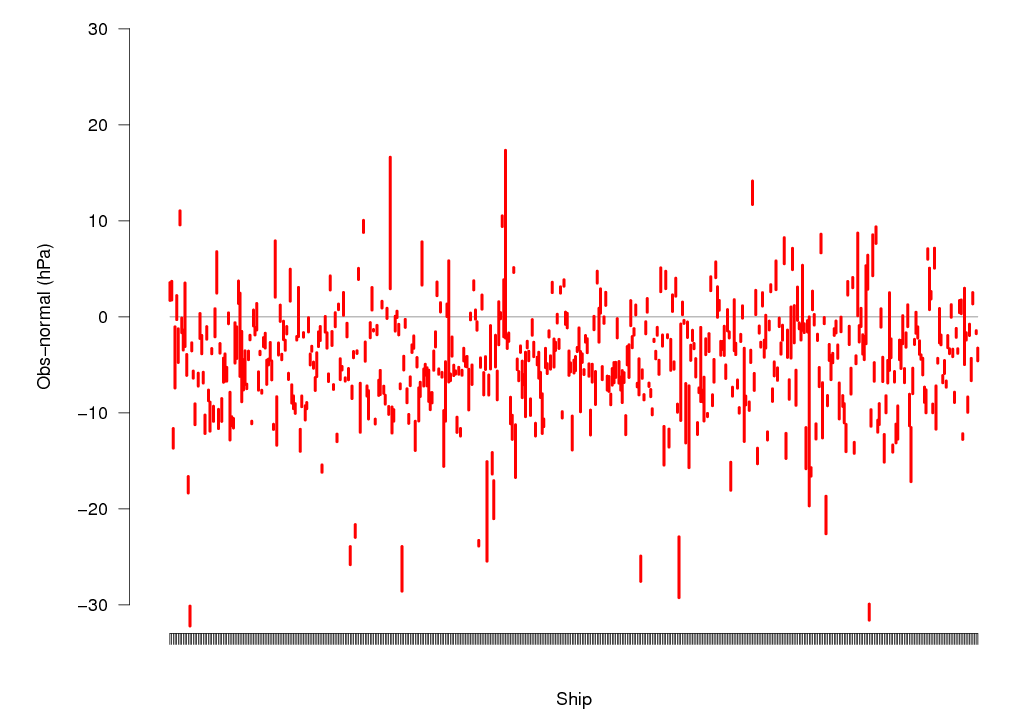
SLP bias in pre-1870 deck 721 observations for each distinct ship (observation ID). (Mean +- 2 standard errors).
Deck 248 shows the same results.
I interpret this to mean that this is an instrument error - early barometers had substantial systematic biases (constant offsets) and those offsets were themselves systematically biased - they were more likely to be negative than positive. These offsets got smaller with time as the instruments improved, becoming small by 1870. [Any ideas for how we might test this interpretation?].
That means we could bias-correct the early observations by calculating a mean offset for each identifiable ship and applying it to all their observations (and put these in IVAD). This is straightforward to do and gets rid of the time-varying biases very nicely:
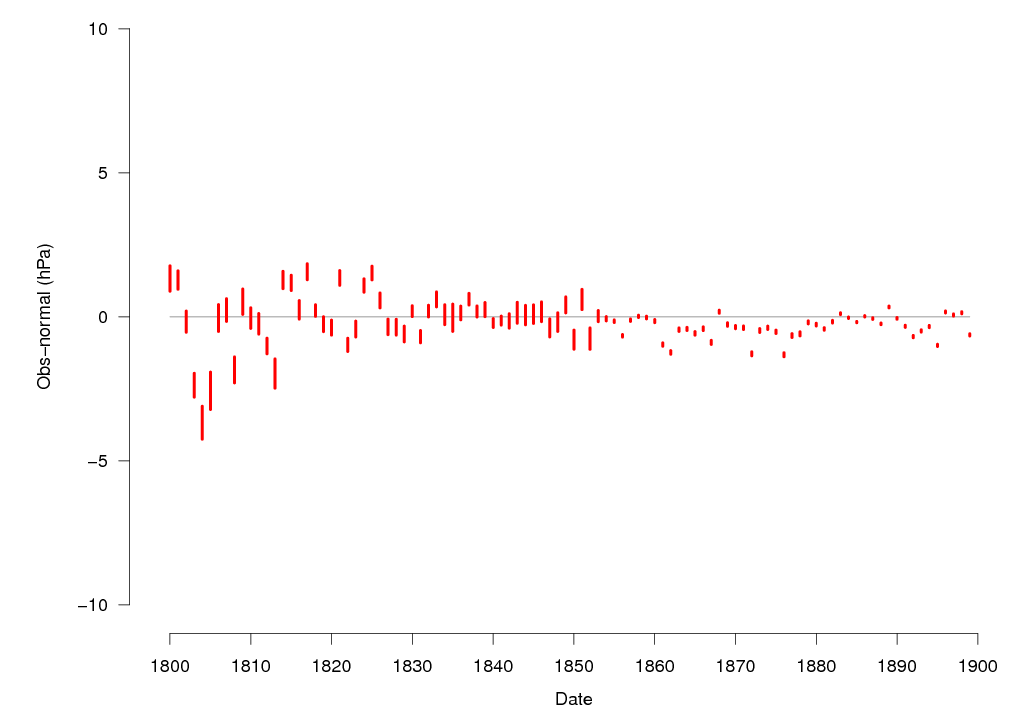
Repeat of top figure, except with a constant bias offset applied to each identifiable ship.
Most ships have a short lifetime, so a ship-specific correction would homogenize the time series even if the cause were not a ship-specific bias. So this figure does not prove that the diagnosis is correct, but it does show that the proposed solution would have the desired effect.
[Response (from Philip) to comment below from Anonymous (a.k.a. Clive Wilkinson)]
I'm pretty sure there are very few aneroid barometers in the pre-1870 obs. Wallbrink et al. 2009 claims there are few in the US Maury (though I'm n ot sure how they know). In the German Maury in some cases the SLP was not corrected for temperature, presumably because those observations did not include a barometer temperature, which could indicate they are aneroid observations. But if we compare the two groups it's clear they should all have been corrected:
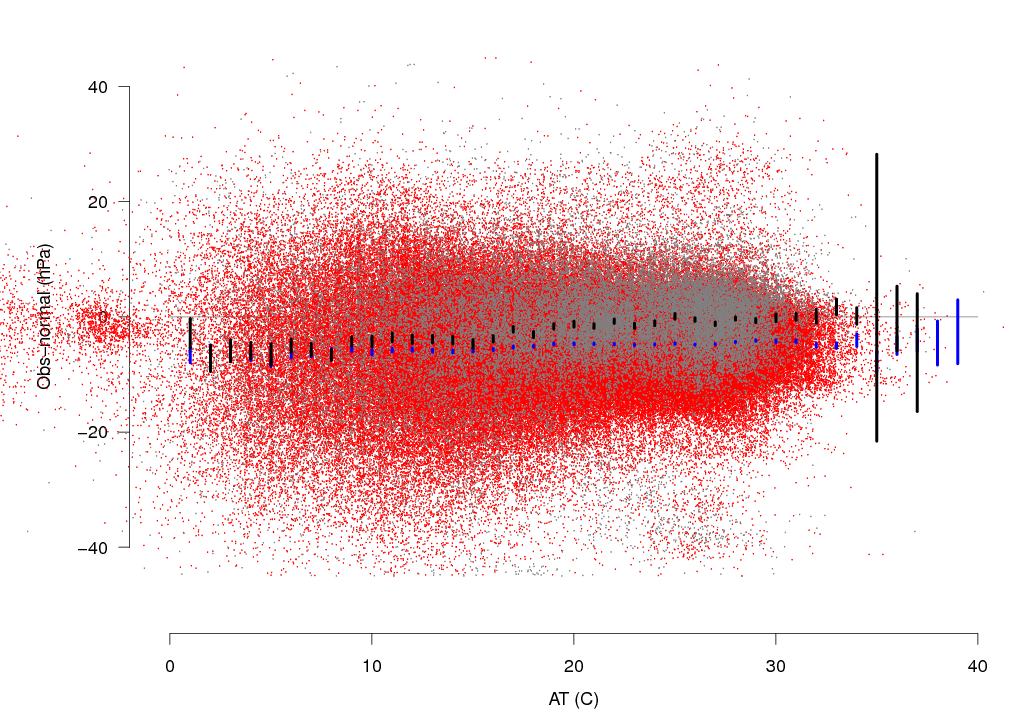
SLP bias in pre-1870 deck 721 observations as a function of observed air temperature, in two groups: Red dots are observations with observed barometer temperatures and temperature corrections made (PB==1 in ICOADS), blue bars are mean+-2se in each 1C AT band; Grey dots are observations without barometer temperatures so no temperature corrections (PB==2), black bars are mean+-2se in each 1C AT band.
If we temperature corrected the grey dots using observed AT for barometer temperature, the temperature dependent bias would disappear, and we'd get the same constant bias as in the corrected obs. So the uncorrected obs need correction, which means they are from mercury barometers, and there is no substantial group of aneroid obs in this deck. This is another bias we could correct, though the effect is modest as the number of non-temperature corrected pressure obs is not that large.
[below: added by Laura Slivinski]
We have also been doing some investigations of this ship bias, as it relates to the 20CRv2c dataset. Below are two maps of the US Maury (deck 701) ship tracks for Jan 1856, colored by bias. In the first figure, the bias is calculated as "obs minus reference," where we have used a climatology of 20CRv2c analysis averaged over 1951-1999. The second figure is the same dataset, but the bias is calculated as "obs minus first guess," ie, the model forecast from the previous analysis step, but before the observation has been assimilated. Generally the behavior is fairly similar, though the "obs minus reference" case definitely seems to make the observation bias look lower.
These figures further suggest that correcting bias on a ship-by-ship basis, or even preprocessing a single ship track, would be a reasonable step, as the ship tracks generally (though not always) have consistent biases. They also hint at the issues with comparing to a climatology, though. (As mentioned in a comment, the climatology may be different between the 1850s and the late 20th century.) However, the "first guess" state is forecasting from analysis states which have already assimilated the biased ship observations, so that might not be ideal on its own either.
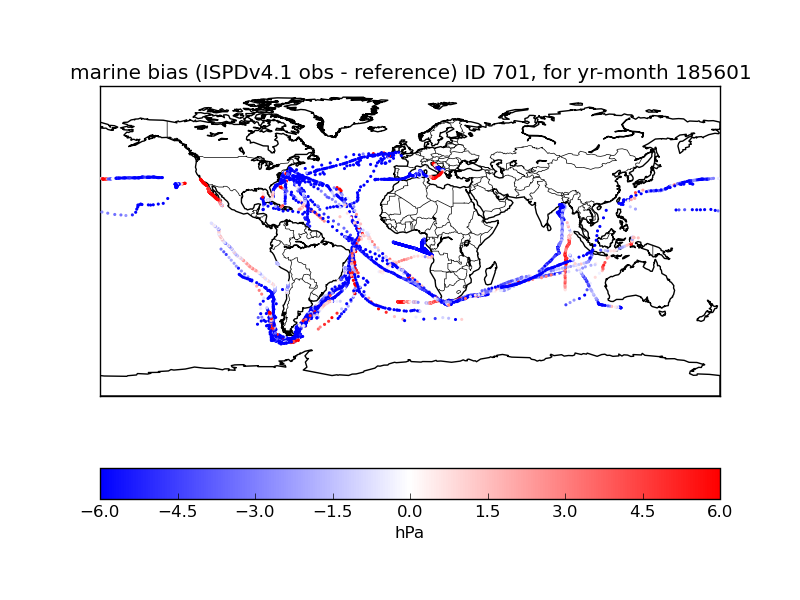
US Maury ship tracks for Jan 1856, colored by (observation minus reference), where reference = 20CRv2c climatology from 1951-1999.
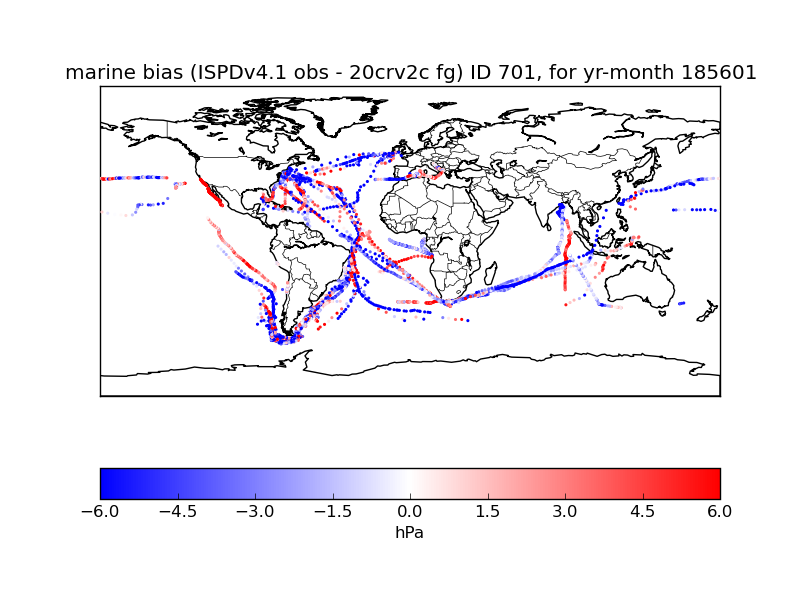
US Maury ship tracks for Jan 1856, colored by (observation minus first guess) where "first guess" is the pre-update forecast from 20CRv2c for that time.
Note: this page was replaced post website update, below are comments that were previously available.
-
Re: Pressure biases in early ship observations
Submitted by Yvan Duil (not verified) on Fri, 05/20/2016 - 13:23.
The only elegant way to get around this would be to used an iterative process. Detecting the bias by comparison to a first get, then removed the bias from the input data and do a second assimilation. Re-iterate a much as needed. Since assimilation is cheap when there is few data points that might be affordable before 1870.
-
Re: Pressure biases in early ship observations
Submitted by Yvan Duil (not verified) on Fri, 05/20/2016 - 09:58.
This is a fundamental problem : bias in data bias the model. ERA-20C had an issue with Tristan da Cunha data that messed the model and the data assimilation process locally. There is no nice way to get around that in data sparse region except by assuming climatology. I am wondering is it would be possible to run the model with the time direction inverted. This way you would start from a data rich environment to a data poor one. This should make easier to spot bias.
-
Re: Pressure biases in early ship observations
Submitted by Anonymous (not verified) on Thu, 05/19/2016 - 06:42.
If the bias is ship specific, and up to c. 1870s, could we be looking at a change from mercurial marine barometers and the introducton of aneroid barometers. Do we have any metadata on the instuments used. Another possibility - what about how the observation is recorded when the barometer is pumping. Was an instruction issued to make obs consistent if before this various ways of observing a pumping barometer had been used.
-
Re: Pressure biases in early ship observations
Submitted by philip on Thu, 05/19/2016 - 09:45.
If pumping were important, I'd expect to see a bigger effect in the mid-latitudes, where the weather is worse and more changeable, than in the tropics. We don't see such an effect - the absence of any substantial variation with Latitude is a strong indication that no interesting physical effect is playing a role, any such effect would be different in the tropics and the mid-latitudes. It also suggests that it's not a change in observing method, as a change in method to minimise the effect of pumping (for example) would effectively increase or decrease the pumping effect, and would vary with latitude. If it's an observing method change it's one that has the same effect in all weather conditions.
I like the idea of a mercury-> aneroid transition, as I think it's plausible that dodgy mercury barometers tend to be biased low, while dodgy aneroid barometers are equally likely to be biased low or high (I've no idea if they are, but it sounds possible). I'll see if there's any metadata on barometer type in the Maury decks.
-
Re: Pressure biases in early ship observations
Submitted by philip on Fri, 05/20/2016 - 10:52.
It turns out not to be a mercury->aneroid transition (see above) - these observations are all from mercury barometers.
-
Re: Pressure biases in early ship observations
Submitted by Yvan Duil (not verified) on Thu, 05/19/2016 - 06:21.
Your procedure looks sound. However, I have an issue with the climatology used. We do expect that some change has occurred over time in pressure field due to climate change . Using a recent climatology might bias the old climatology to look more like the modern one than it used to.
-
Re: Pressure biases in early ship observations
Submitted by Yvan Duil (not verified) on Thu, 05/19/2016 - 10:01.
No win here obviously. Actually debiasing should be done on every ship data backward of 1980.
Re: Pressure biases in early ship observations
Submitted by philip on Thu, 05/19/2016 - 09:47.
It would be better to use a C19 climatology, but any such climatology would be contaminated by the obs. being examined, and I was keen to avoid that complication.
Impact on predictive skill
In theory such bias correction should improve the predictive skill of the model even if the assimilation scheme is already doing some correction.