Wondering why abrupt PNA shift evident in the Leathers and Palecki (1992) PNA is not apparent in semi-current (as of Oct 2009) NCEP NCAR reanalysis data (Part I)

Created by Steven.Mauget on - Updated on 07/18/2016 10:13
 
 
A collaborator and I  have a paper in the Journal of Climate under review that (indirectly) involves the use of NCEP-NCAR reanalysis data. The problem is that we've come across a disagreement between the NCEP-NCAR reanalysis  and an older reanalysis used by Leathers and Palecki (1992) and were wondering, basically, which one is right. 
 
Our paper uses an approach to times series analysis that involves sampling data rankings over moving time windows . I won't go over the details of the method here (see, e.g.,   Mauget et al. ( 2012)), but in the paper it  detected an abrupt regime shift in temperature over the eastern U.S.  in the late 1950's.  In the paper we show this shift in two  Figures (see Figs. 1d and 2d,e,f ).  This shift was also noted years ago by Namias (1972) , and Dickson and Namias (1976), so we also included figures from those two papers in our paper for comparison  (see Figs. 1c and 2a,b,c ). 
 
Figure 1
 
 
Figure 2


At the same time this shift to colder eastern U.S.temperatures was evident in the late 1950's, Leathers and Palecki (1992) noted an abrupt shift to positive PNA index values. This PNA shift was driven mainly  by an abrupt drop in geopotential heights  over the southeastern US around 1957.   Since that decadal downward regime shift  in 700 mb Z was consistent with the eastern U.S. cooling shift that Namias(1972) and Dickson and Namias(1976) noted, we included figures from Leathers and Palecki (1992) that illustrated that PNA and 700 mb Z shift (see Figs. 1a,b).  
 
 
We sent the paper out to be reviewed, and one of the reviewers suggested that instead of showing the Leathers and Palecki (1992) results, we generate our own series for the PNA and the PNA centers of action from more recent data. So I generated those series from the NCEP-NCAR I reanalysis  700 mb Z data I had on hand, which ended in October 2009. I  followed the same procedures for generating the series that was outlined in Leathers et al. (1991), i.e., 13 month running filter etc. Afterwards I compared my PNA index with  a similarly filtered PNA index derived from the CPC's monthly PNA values.  Both correlate pretty highly (r=.918), even though the CPC PNA is derived from Z anomalies at 4 centers of action and the Leathers et al. (1991) PNA is a 3 point index. So I'm fairly sure no dumb mistakes were made.
 
When you compare the  Leathers and Palecki (1992)  results and and our similarly organized PNA series in Fig. 3 below you can see that the abrupt  PNA shift evident in the Leathers and Palecki  PNA is not found in the current NCEP NCAR reanalysis data. This is mainly because the  drop in 700 mb Z over the southeastern US in ~ 1957 that is evident in Leathers and Palecki's results (their Fig. 1d) is not evident in the reanalysis data we're using (our Fig. 3d).
 
Leathers and Palecki (1992) Fig.1


Figure 3


I always thought that the southeastern U.S. shift in 700 mb Z  shown in Leathers and Palecki (1992) (Their Fig. 1b) seemed kind of exaggerated. On the other hand, it is completely absent in the NCEP-NCAR reanalysis even though our analysis and those of Namias (1972) and Dickson and Namias  (1976) show a decadal shift to cooler temperatures over the southeastern U.S. during the 1960's.  My guess is that kind of persistent shift to cooler temperatures would also lead to some kind of drop in lower atmosphere Z, but there is no trace of that in the NCEP-NCAR data.
 
So our question is: Why is this drop in geopotential clearly evident in the Leathers and Palecki PNA index - which was derived from NMC daily 700 mb octoganal grid analyses - but not apparent in  NCEP-NCAR 700 mb Z?   Could this late 1950's geopotential shift may have been identified as a spurious feature in the NCEP-NCAR reanalysis and adjusted out somehow?  Was the shift in the Leathers and Palecki (1992) seen as some kind of reanalysis artifact, or a consequence of a shift in the radiosonde data?  They consider this possibility in Leathers and Palecki (1992), but show similar shifts in radiosonde Z and surface temperature over the southeastern U.S.
 
I've taken a look at the reanalysis problems list  at http://www.esrl.noaa.gov/psd/data/reanalysis/problems.shtml. I see that the daily times that data was collected changed in 1957 – about the same time we see the 700mb Z shift in Fig. 1b -  but other than that I don't see anything related to this problem.  Does anyone at Reanalyses.org have any ideas on this?
 
References
 

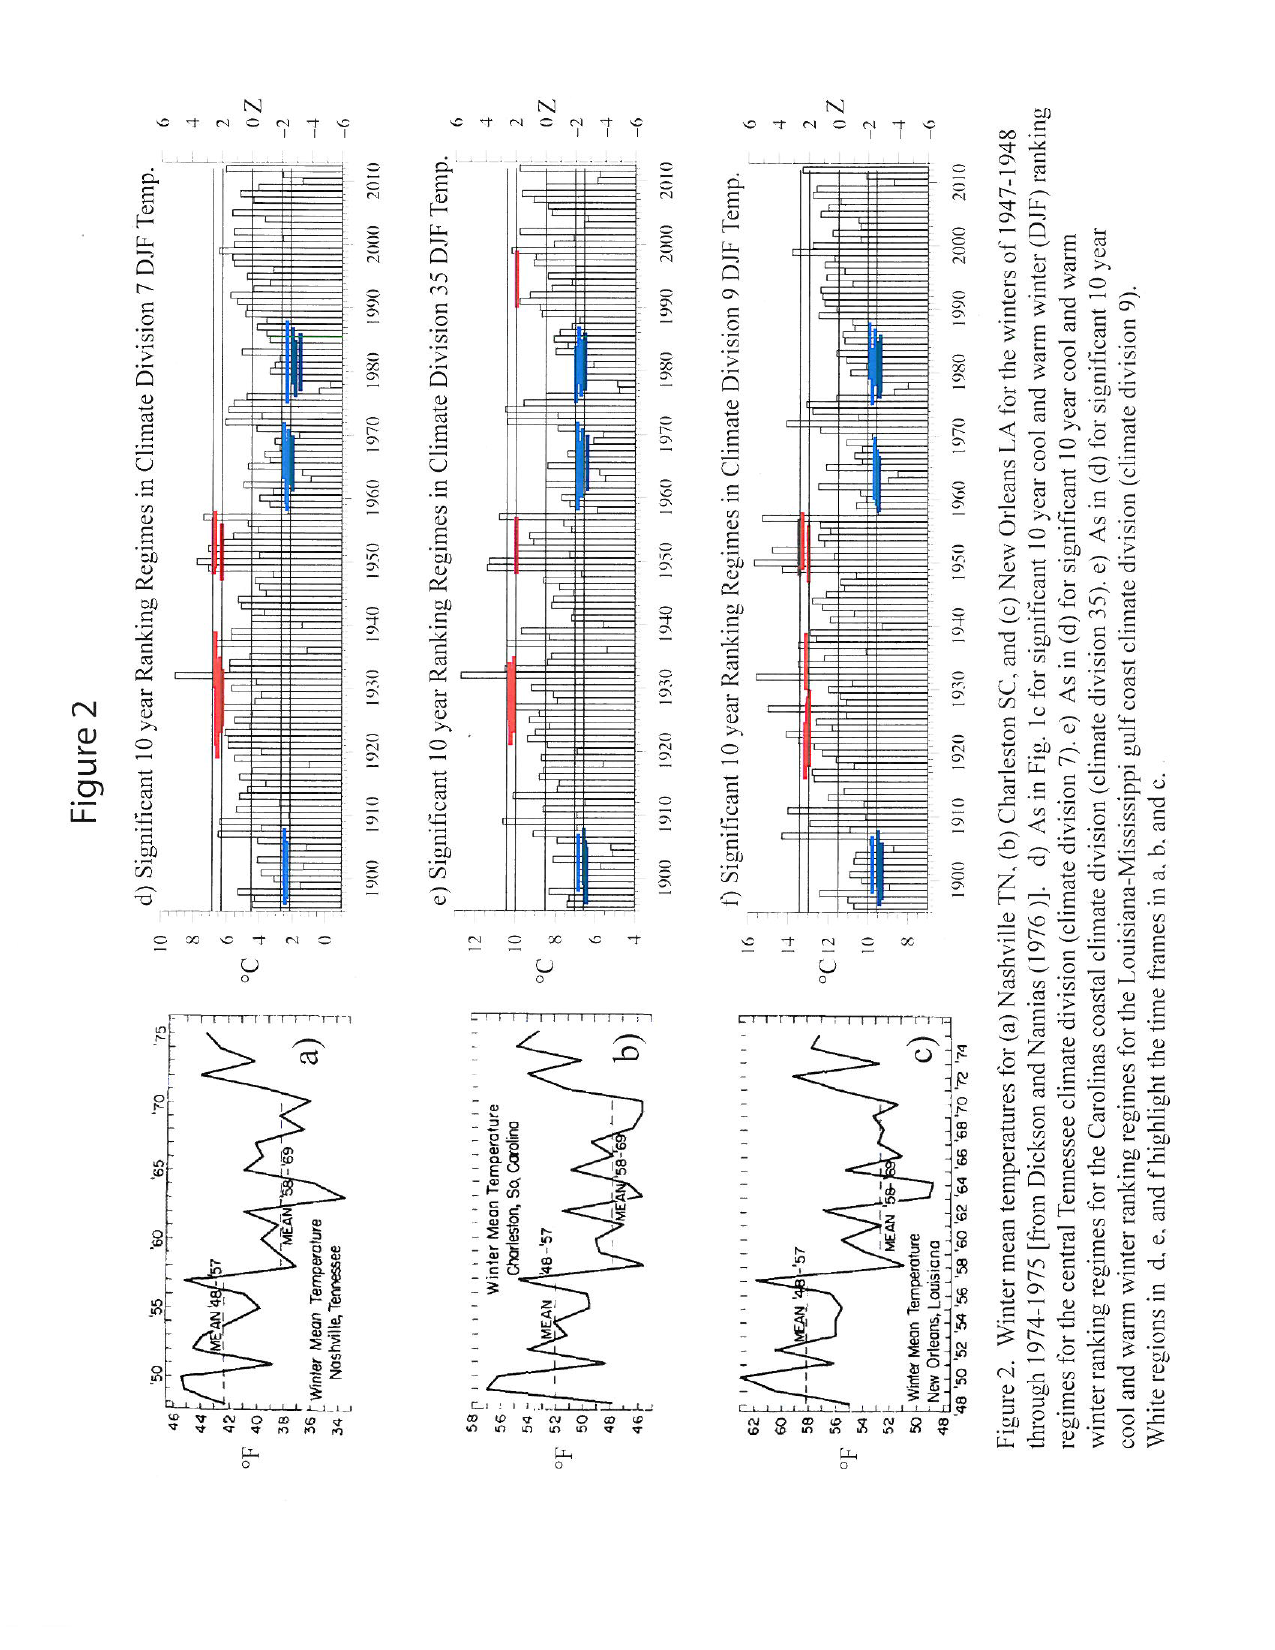
Dickson, R. R. and J. Namias (1976). "North American Influences on the Circulation and Climate of the North Atlantic Sector." Monthly Weather Review 104(10): 1255-1265.


Leathers, D. J., et al. (1991). "The Pacific/North American Teleconnection Pattern and United States Climate. Part I: Regional Temperature and Precipitation Associations." Journal of Climate 4(5): 517-528.


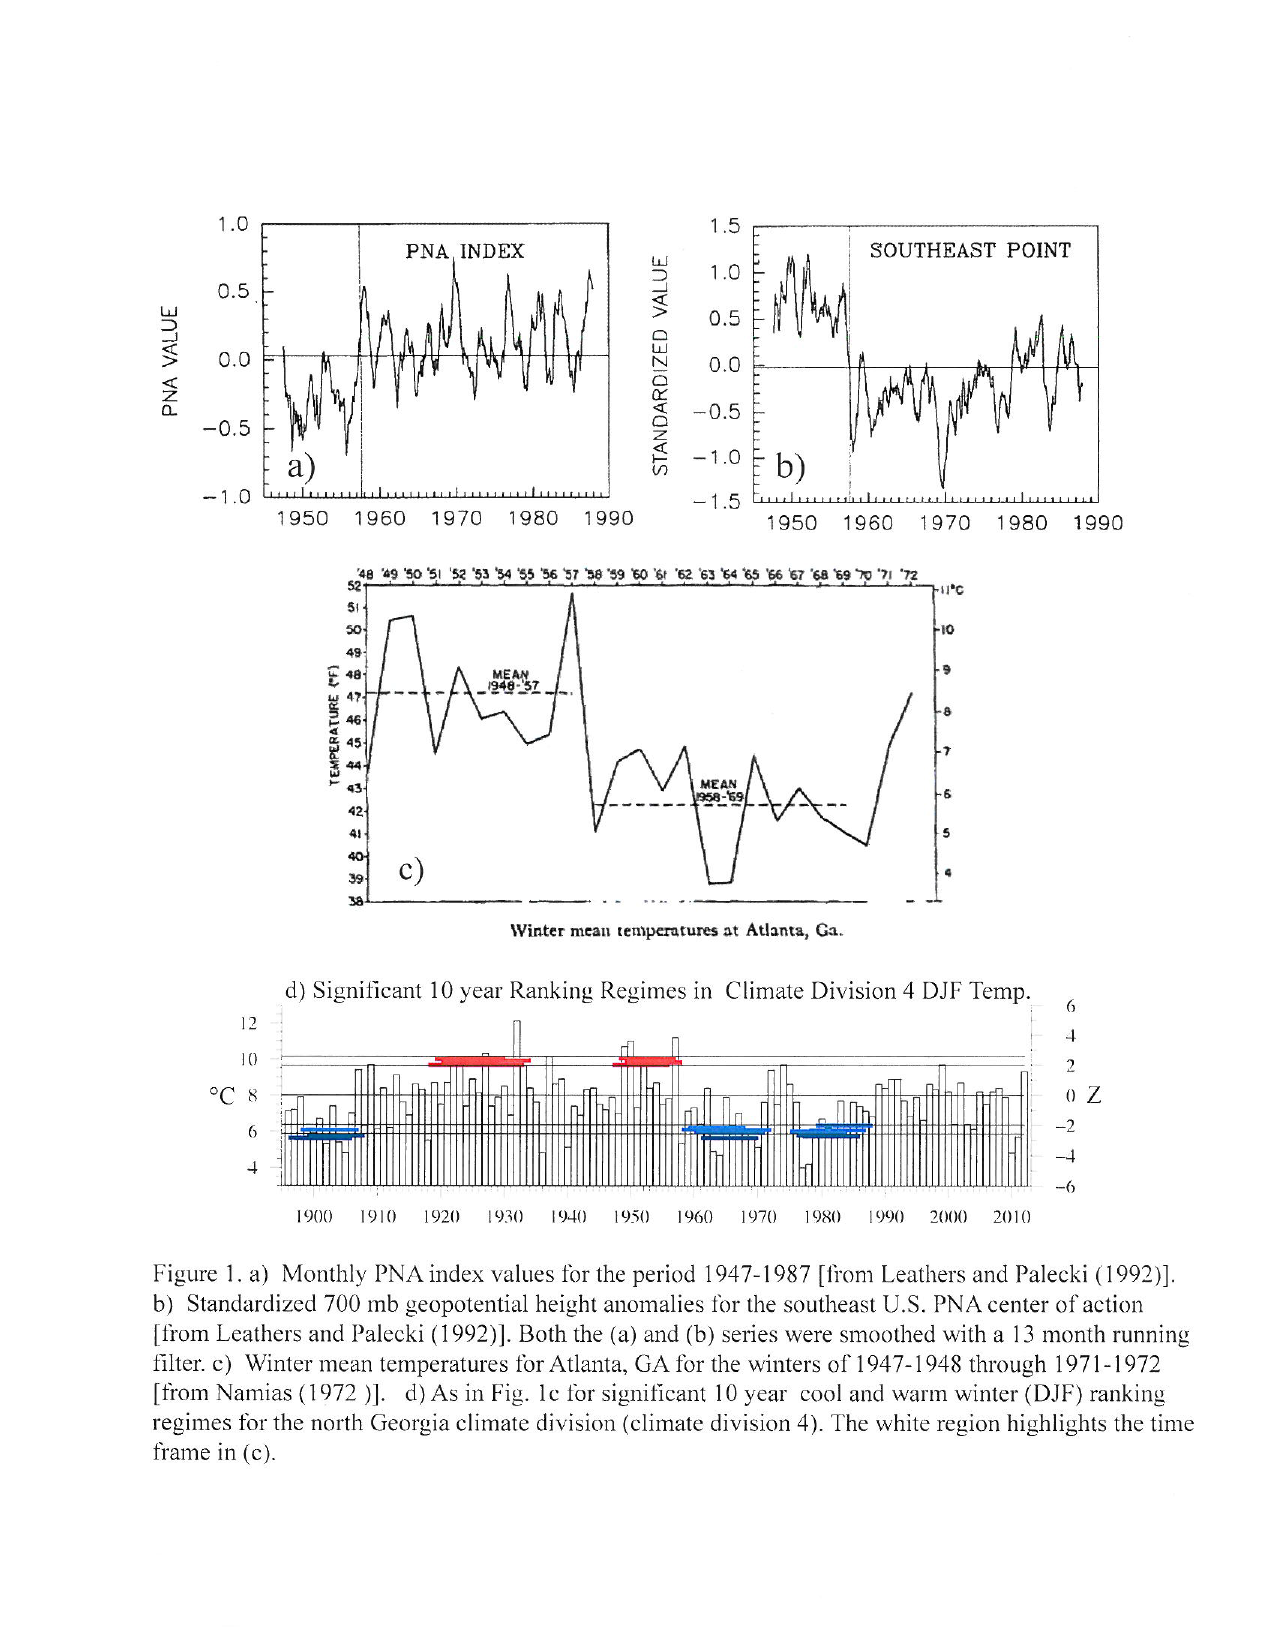
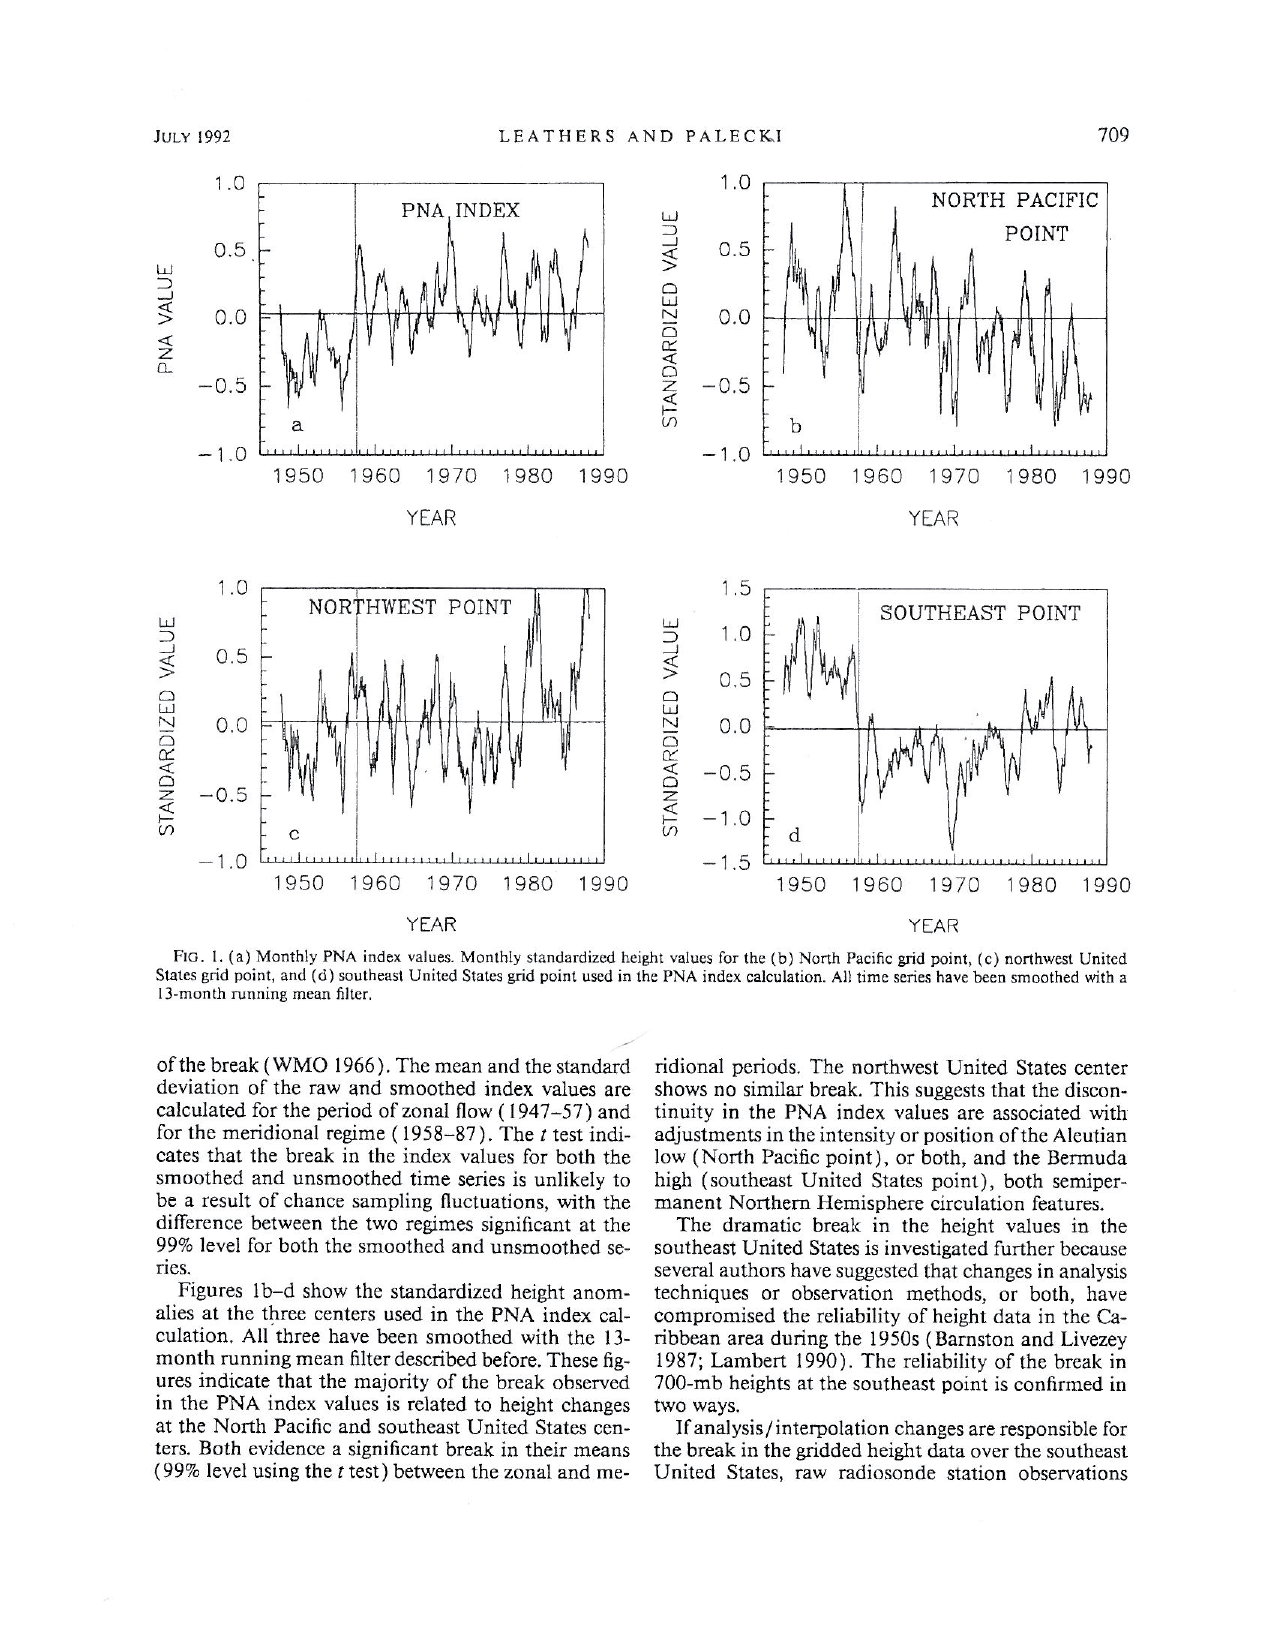
Leathers, D. J. and M. A. Palecki (1992). "The Pacific/North American Teleconnection Pattern and United States Climate. Part II: Temporal Characteristics and Index Specification." Journal of Climate 5(7): 707-716.


Mauget, S. A., et al. (2012). "Evaluating Modeled Intra- to Multidecadal Climate Variability Using Running Mann–Whitney Z Statistics." Journal of Climate 25(5): 1570-1586.


Namias, J. (1972). "Experiments in Objectively Predicting Some Atmospheric and Oceanic Variables for the Winter of 1971–72." Journal of Applied Meteorology 11(8): 1164-1174.


Wesley Ebisuzaki (not verified)

Wed, 05/14/2014 - 12:55

I don't have an answer but I have some comments. Your PNA index is based on 3 points which are in the North Pacific, SW Alberta and in the Gull off Alabama. If you plot the upper data (adupa, sondes + pibals) using http://nomad1.ncep.noaa.gov/cgi-bin/pdisp_r1_obs.sh you can see the upper air data in the late 1950s. The North Pacific is poorly covered. The other two points are near the CONUS so their quality would be better than no nearby stations but worse than if they in the CONUS. So their is some concern about the accuracy of the PNA index. Perhaps you should define your own PNA index and put the 3 points on top of long-term rawinsonde stations like in the Aleutian Islands. Leathers et al found a discontinuity in the Z700 around 1957 (fig 1b). Now IGY (International Geophysical Year) was in 1957-1958 and the launch times for radiosondes were standardized to 00Z and 12Z. A change in the launch times could create a break in the Z700 as seen in fig 1b if the analysis scheme did not account for the diurnal cycle. (I would be surprised if the old analyses accounted for the diurnal cycle because where would they get the diurnal cycle data?) On the other hand, the NCEP/NCAR Reanalysis (R1) should be insensitive to the launch times because the diuranal cycle is generated by the forecast model. There will be some sensitivity to the launch time because the model has an imperfect diurnal cycle. The next step would be to figure out the launch times. I didn't find it with google, so have to look at the bufr files.

Wesley:

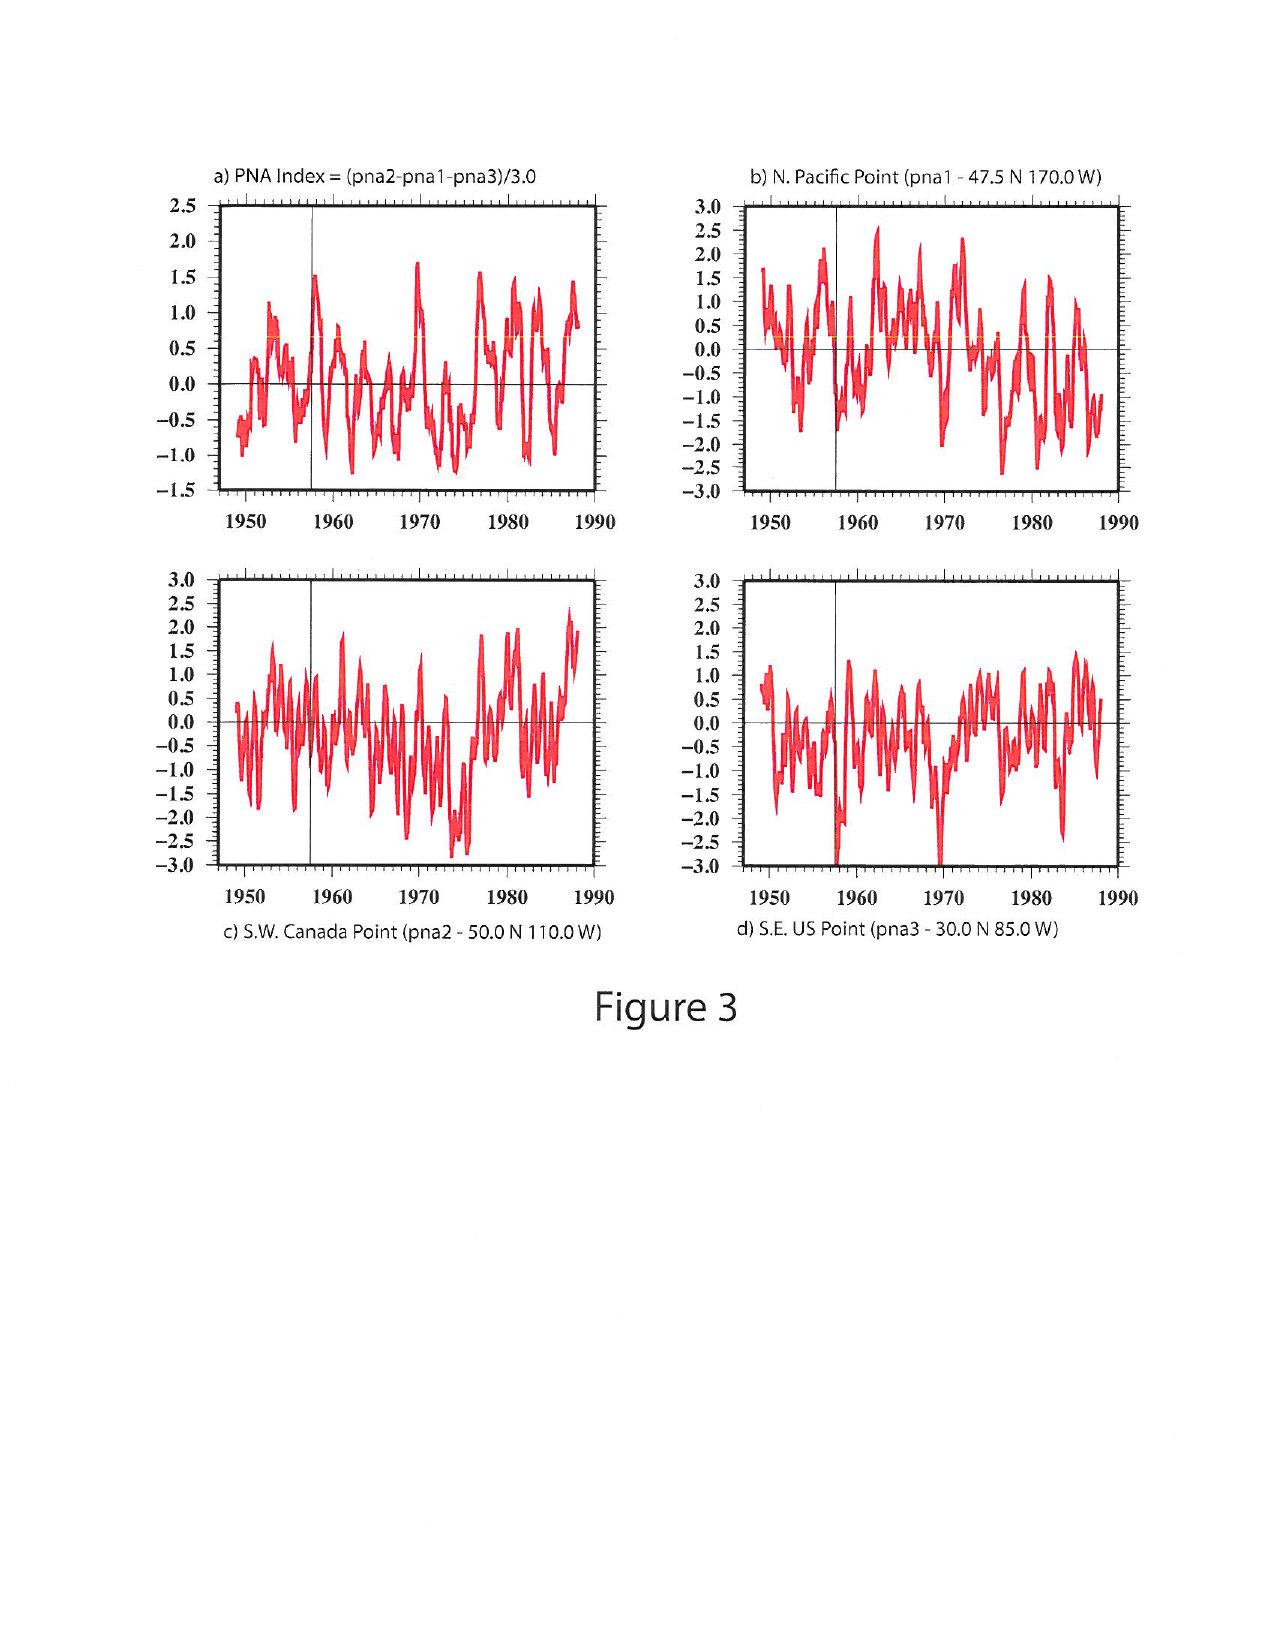
Thanks for your comments. I'm not so much concerned about the overall PNA variability as much as I am the 700 mb variation over the southeast U.S.(SEUS) PNA center of action. Leathers and Palecki (1992) actually addressed skepticism about the 1957 SEUS 700 mb Z drop by making two points.

First, they demonstrated that the regime shift in Z was present in the rawinsonde data (Their Fig. 2a), so they reasoned that it couldn't be due to some change in the analysis procedures.

Second, they noted the change in observation times during the 1957-58 IGY, which basically moved the twice daily obs backward from 1500 & 0300 Z to 1200 & 0000 Z. However, after presenting evidence of an abrupt shift in SEUS temperature regime regime (their Fig. 2b), they reasoned that the shift was due to the change in surface forcing and not the change in observation times. I'm not sure I completely buy their logic on that, but I still think that their Fig. 1d SEUS Z drop was due to surface forcing for two reasons. First, if the change in observation times had that effect in the SEUS PNA center of action ,why didn't it have a similar effect on the southern Alberta center of action (their Fig. 1c)? Second, I'm not that familiar with how rawinsonde data is processed, but I assume the twice daily measurements are averaged to remove daily Z variation. Would changing twice-daily upper-air obs by 3 hours have that much of an effect on the daily average Z height measurement? Leather's and Palecki's Fig. 1d, which shows the normalized 700 mb Z drop, has Z dropping by ~ 1 standard deviation. Although I can't prove it, my guess is that was not due to a relatively minor shift in observation times.

My hunch, which doesn't pull much weight with most reviewers, is that the 1957 SEUS 700 mb Z drop in Fig. 1d was real. But I have no idea why its not apparent in the NCEP-NCAR 700 mb Z reanalysis data.

Thanks again for you input,

Steve M.

gilbert.p.comp…

Tue, 05/13/2014 - 09:27

Dear Steven, You may want to look at the 20th Century Reanalysis data (http://go.usa.gov/XTd ). 20CR only uses pressure observations. A version of the PNA series is shown in Compo et al. 2011 http://dx.doi.org/10.1002/qj.776 . You can compare each center of action with NCEP-NCAR reanalsis using the WRIT timeseries tool or look at maps https://reanalyses.org/atmosphere/writ , in addition to downloading the data for your own analysis. The NMC analyses had many discontinuities. One of the main reasons to perform reanalysis with the same model and assimilation method is reduce discontinuities that arise from changing methods (see references in Compo et al. 2011 for a detailed discussion of this point). The Kistler et al. 2001 BAMS paper talks about some of the radiosonde corrections. Given the changes in the radiosonde and global observing network associated with the International Geophysical Year in 1957 and 1958, any shifts in original analyses in particular, have to be treated cautiously. Please let me know if I can be of any additional help. best wishes, gil compo

Add new comment

CAPTCHA
This question is for testing whether or not you are a human visitor and to prevent automated spam submissions.