

Dickson, R. R. and J. Namias (1976). "North American Influences on the Circulation and Climate of the North Atlantic Sector." Monthly Weather Review 104(10): 1255-1265.
Leathers, D. J., et al. (1991). "The Pacific/North American Teleconnection Pattern and United States Climate. Part I: Regional Temperature and Precipitation Associations." Journal of Climate 4(5): 517-528.
Leathers, D. J. and M. A. Palecki (1992). "The Pacific/North American Teleconnection Pattern and United States Climate. Part II: Temporal Characteristics and Index Specification." Journal of Climate 5(7): 707-716.
Mauget, S. A., et al. (2012). "Evaluating Modeled Intra- to Multidecadal Climate Variability Using Running Mann–Whitney Z Statistics." Journal of Climate 25(5): 1570-1586.
Namias, J. (1972). "Experiments in Objectively Predicting Some Atmospheric and Oceanic Variables for the Winter of 1971–72." Journal of Applied Meteorology 11(8): 1164-1174.
Re: Wondering why abrupt PNA shift evident in the Leathers ...
Wesley:
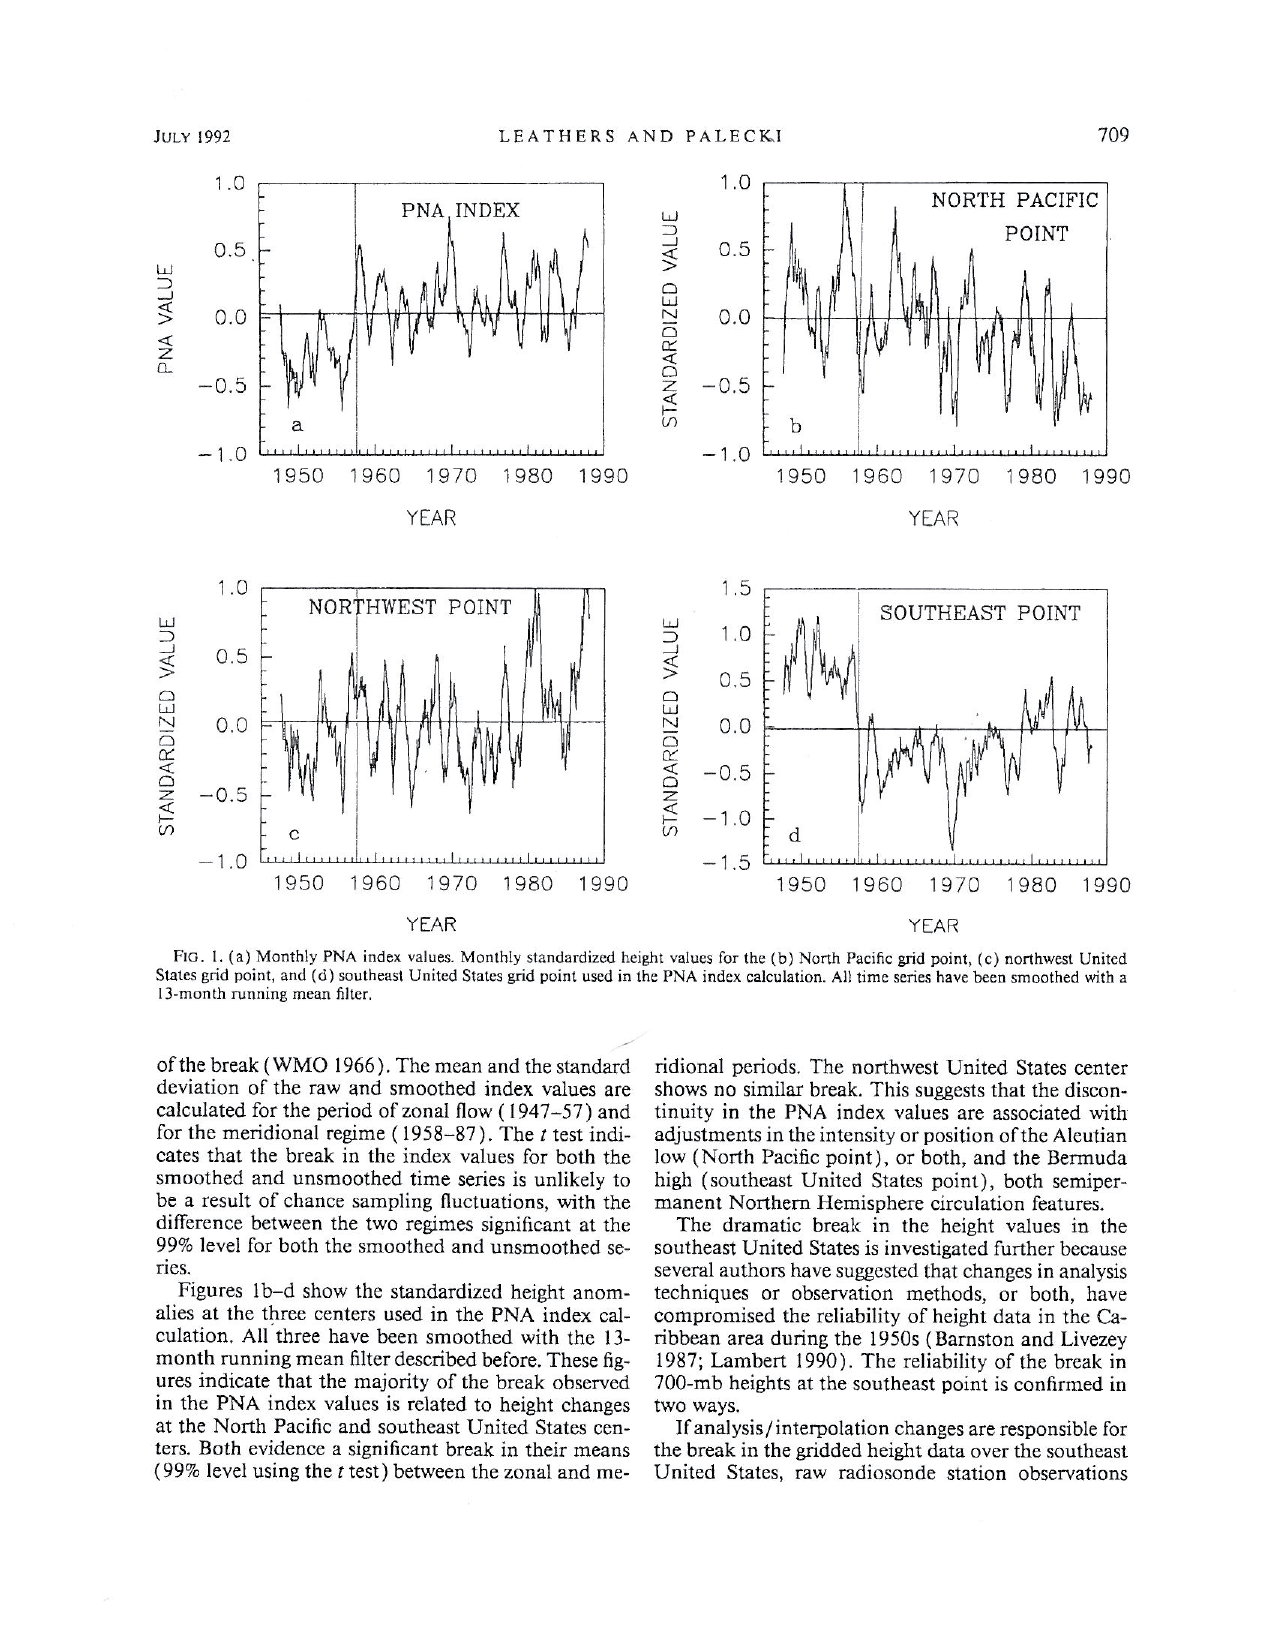
Thanks for your comments. I'm not so much concerned about the overall PNA variability as much as I am the 700 mb variation over the southeast U.S.(SEUS) PNA center of action. Leathers and Palecki (1992) actually addressed skepticism about the 1957 SEUS 700 mb Z drop by making two points.
First, they demonstrated that the regime shift in Z was present in the rawinsonde data (Their Fig. 2a), so they reasoned that it couldn't be due to some change in the analysis procedures.
Second, they noted the change in observation times during the 1957-58 IGY, which basically moved the twice daily obs backward from 1500 & 0300 Z to 1200 & 0000 Z. However, after presenting evidence of an abrupt shift in SEUS temperature regime regime (their Fig. 2b), they reasoned that the shift was due to the change in surface forcing and not the change in observation times. I'm not sure I completely buy their logic on that, but I still think that their Fig. 1d SEUS Z drop was due to surface forcing for two reasons. First, if the change in observation times had that effect in the SEUS PNA center of action ,why didn't it have a similar effect on the southern Alberta center of action (their Fig. 1c)? Second, I'm not that familiar with how rawinsonde data is processed, but I assume the twice daily measurements are averaged to remove daily Z variation. Would changing twice-daily upper-air obs by 3 hours have that much of an effect on the daily average Z height measurement? Leather's and Palecki's Fig. 1d, which shows the normalized 700 mb Z drop, has Z dropping by ~ 1 standard deviation. Although I can't prove it, my guess is that was not due to a relatively minor shift in observation times.
My hunch, which doesn't pull much weight with most reviewers, is that the 1957 SEUS 700 mb Z drop in Fig. 1d was real. But I have no idea why its not apparent in the NCEP-NCAR 700 mb Z reanalysis data.
Thanks again for you input,
Steve M.
Re: Wondering why abrupt PNA shift evident in the Leathers ...
Re: Wondering why abrupt PNA shift evident in the Leathers ...
Gil:
Thanks a lot… those are all very helpful suggestions. I've downloaded your 20Cr paper and the Kistler paper and I'll see what information they provide.
Steve Mauget
Re: Wondering why abrupt PNA shift evident in the Leathers ...