This study evaluates the performance of NASA’s Modern-Era Retrospective Analysis for Research and Applications (MERRA) precipitation product in reproducing the trend and distribution of extreme precipitation events. Utilizing the extreme value theory, time-invariant and time-variant extreme value distributions are developed to model the trends and changes in the patterns of extreme precipitation events over the contiguous United States during 1979–2010. The Climate Prediction Center (CPC) U.S. Unified gridded observation data are used as the observational dataset. The study is carried out at daily and 0.5 degree temporal and spatial resolutions.
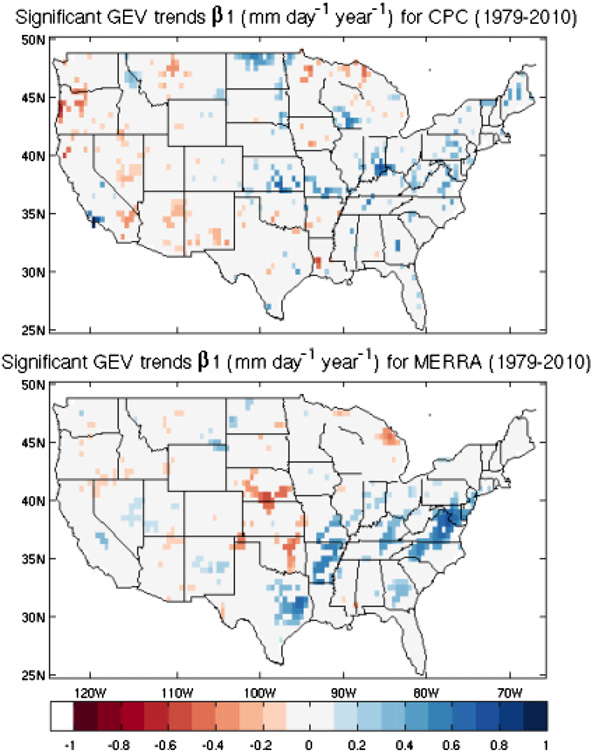
The CPC analysis shows that the eastern and western parts of the United States are experiencing positive and negative trends in annual maxima of daily precipitation, respectively. The continental-scale patterns of change found in MERRA seem to reasonably mirror the observed patterns of change found in CPC. This is not previously expected, given the difficulty in constraining precipitation in reanalysis products. MERRA tends to overestimate the frequency at which the 99th percentile of precipitation is exceeded because this threshold tends to be lower in MERRA, making it easier to be exceeded. This feature is dominant during the summer months. MERRA tends to reproduce spatial patterns of the scale and location parameters of the generalized extreme value and generalized Pareto distributions. However, MERRA underestimates these parameters, particularly over the Gulf Coast states, leading to lower magnitudes in extreme precipitation events. Two issues in MERRA are identified: 1) MERRA shows a spurious negative trend in Nebraska and Kansas, which is most likely related to the changes in the satellite observing system over time that has apparently affected the water cycle in the central United States, and 2) the patterns of positive trend over the Gulf Coast states and along the East Coast seem to be correlated with the tropical cyclones in these regions. The analysis of the trends in the seasonal precipitation extremes indicates that the hurricane and winter seasons are contributing the most to these trend patterns in the southeastern United States. In addition, the increasing annual trend simulated by MERRA in the Gulf Coast region is due to an incorrect trend in winter precipitation extremes.
Hamed Ashouri, Soroosh Sorooshian, Kuo-Lin Hsu, Michael G. Bosilovich, Jaechoul Lee, Michael F. Wehner, and Allison Collow, 2016: Evaluation of NASA’s MERRA Precipitation Product in Reproducing the Observed Trend and Distribution of Extreme Precipitation Events in the United States. J. Hydrometeor., 17, 693–711, doi: 10.1175/JHM-D-15-0097.1.