Lübken, F.-J., U. Berger, and G. Baumgarten (2013),
Temperature trends in the midlatitude summer mesosphere,
J. Geophys. Res. Atmos., 118, doi: 10.1002/2013JD020576.
A trend analysis of long term runs have been performed with the LIMA model (0-150 km altitude) applying the NOAA-CIRES 20th Century Reanalysis (V2) from 2009 back to 1871. LIMA adapts the Reanalysis data (u,v,T) with global coverage every 6 hour below about 25 km applying a nudging method. Variations of green house gases CO2 and O3 have been predescribed according to observations. Trends have been estimated in the troposphere, stratosphere, and mesosphere at mid-latitudes for summer conditions (June - August).
As a main result trends are non-uniform with time.
Since the late 19th century, temperatures in the mesosphere have dropped by up to 5-7 K (10-12 K) on pressure (geometric) altitudes.
This is much more than typical trends in the troposphere and stratosphere. The summer mesosphere therefore reacts much more sensitive to climate change compared to lower altitudes.
Short summary:
In Fig. 1 we show mean June to August temperatures at 54°N from LIMA at geometric height of 70 km based on NOAA-CIRES 20th Century Reanalysis. We have performed a multivariate fit based on three functions (also shown in Fig. 1), namely CO2(t), O3(t), and Ly-alpha(t). The largest contribution to the long term temperature trend comes from CO2, whereas O3 has an impact in the last 30 years only (by construction), and Ly-alpha(t) causes a quasi-periodical modulation. Obviously, temperature trends are not uniform in time but accelerate since approximately the 1960s. Comparison with CO2(t) clearly shows that this acceleration is due to an increase of carbon dioxide. We have calculated temperature trends in three periods, namely from the beginning of the time series (1871) to 1960, from 1960 to present time (2008), and over the entire period. The results are shown in Fig. 2. As expected, trends are larger in the second period. In pressure coordinates, total temperature trends are largest in the upper stratosphere and mesosphere, more precisely at 40-70 km. Trends are minimal around the mesopause. In geometric heights, trends are generally larger and, for the second period 1960-2008, clearly maximize in the mesosphere, where trends can be as large as -1.8 K/dec. We note that this trend analysis produces very similar results in comparison with a detailed trend analysis using ECMWF reanalysis data in the period 1961-2009 (for more details, see Lübken et al, JGR, 2013).
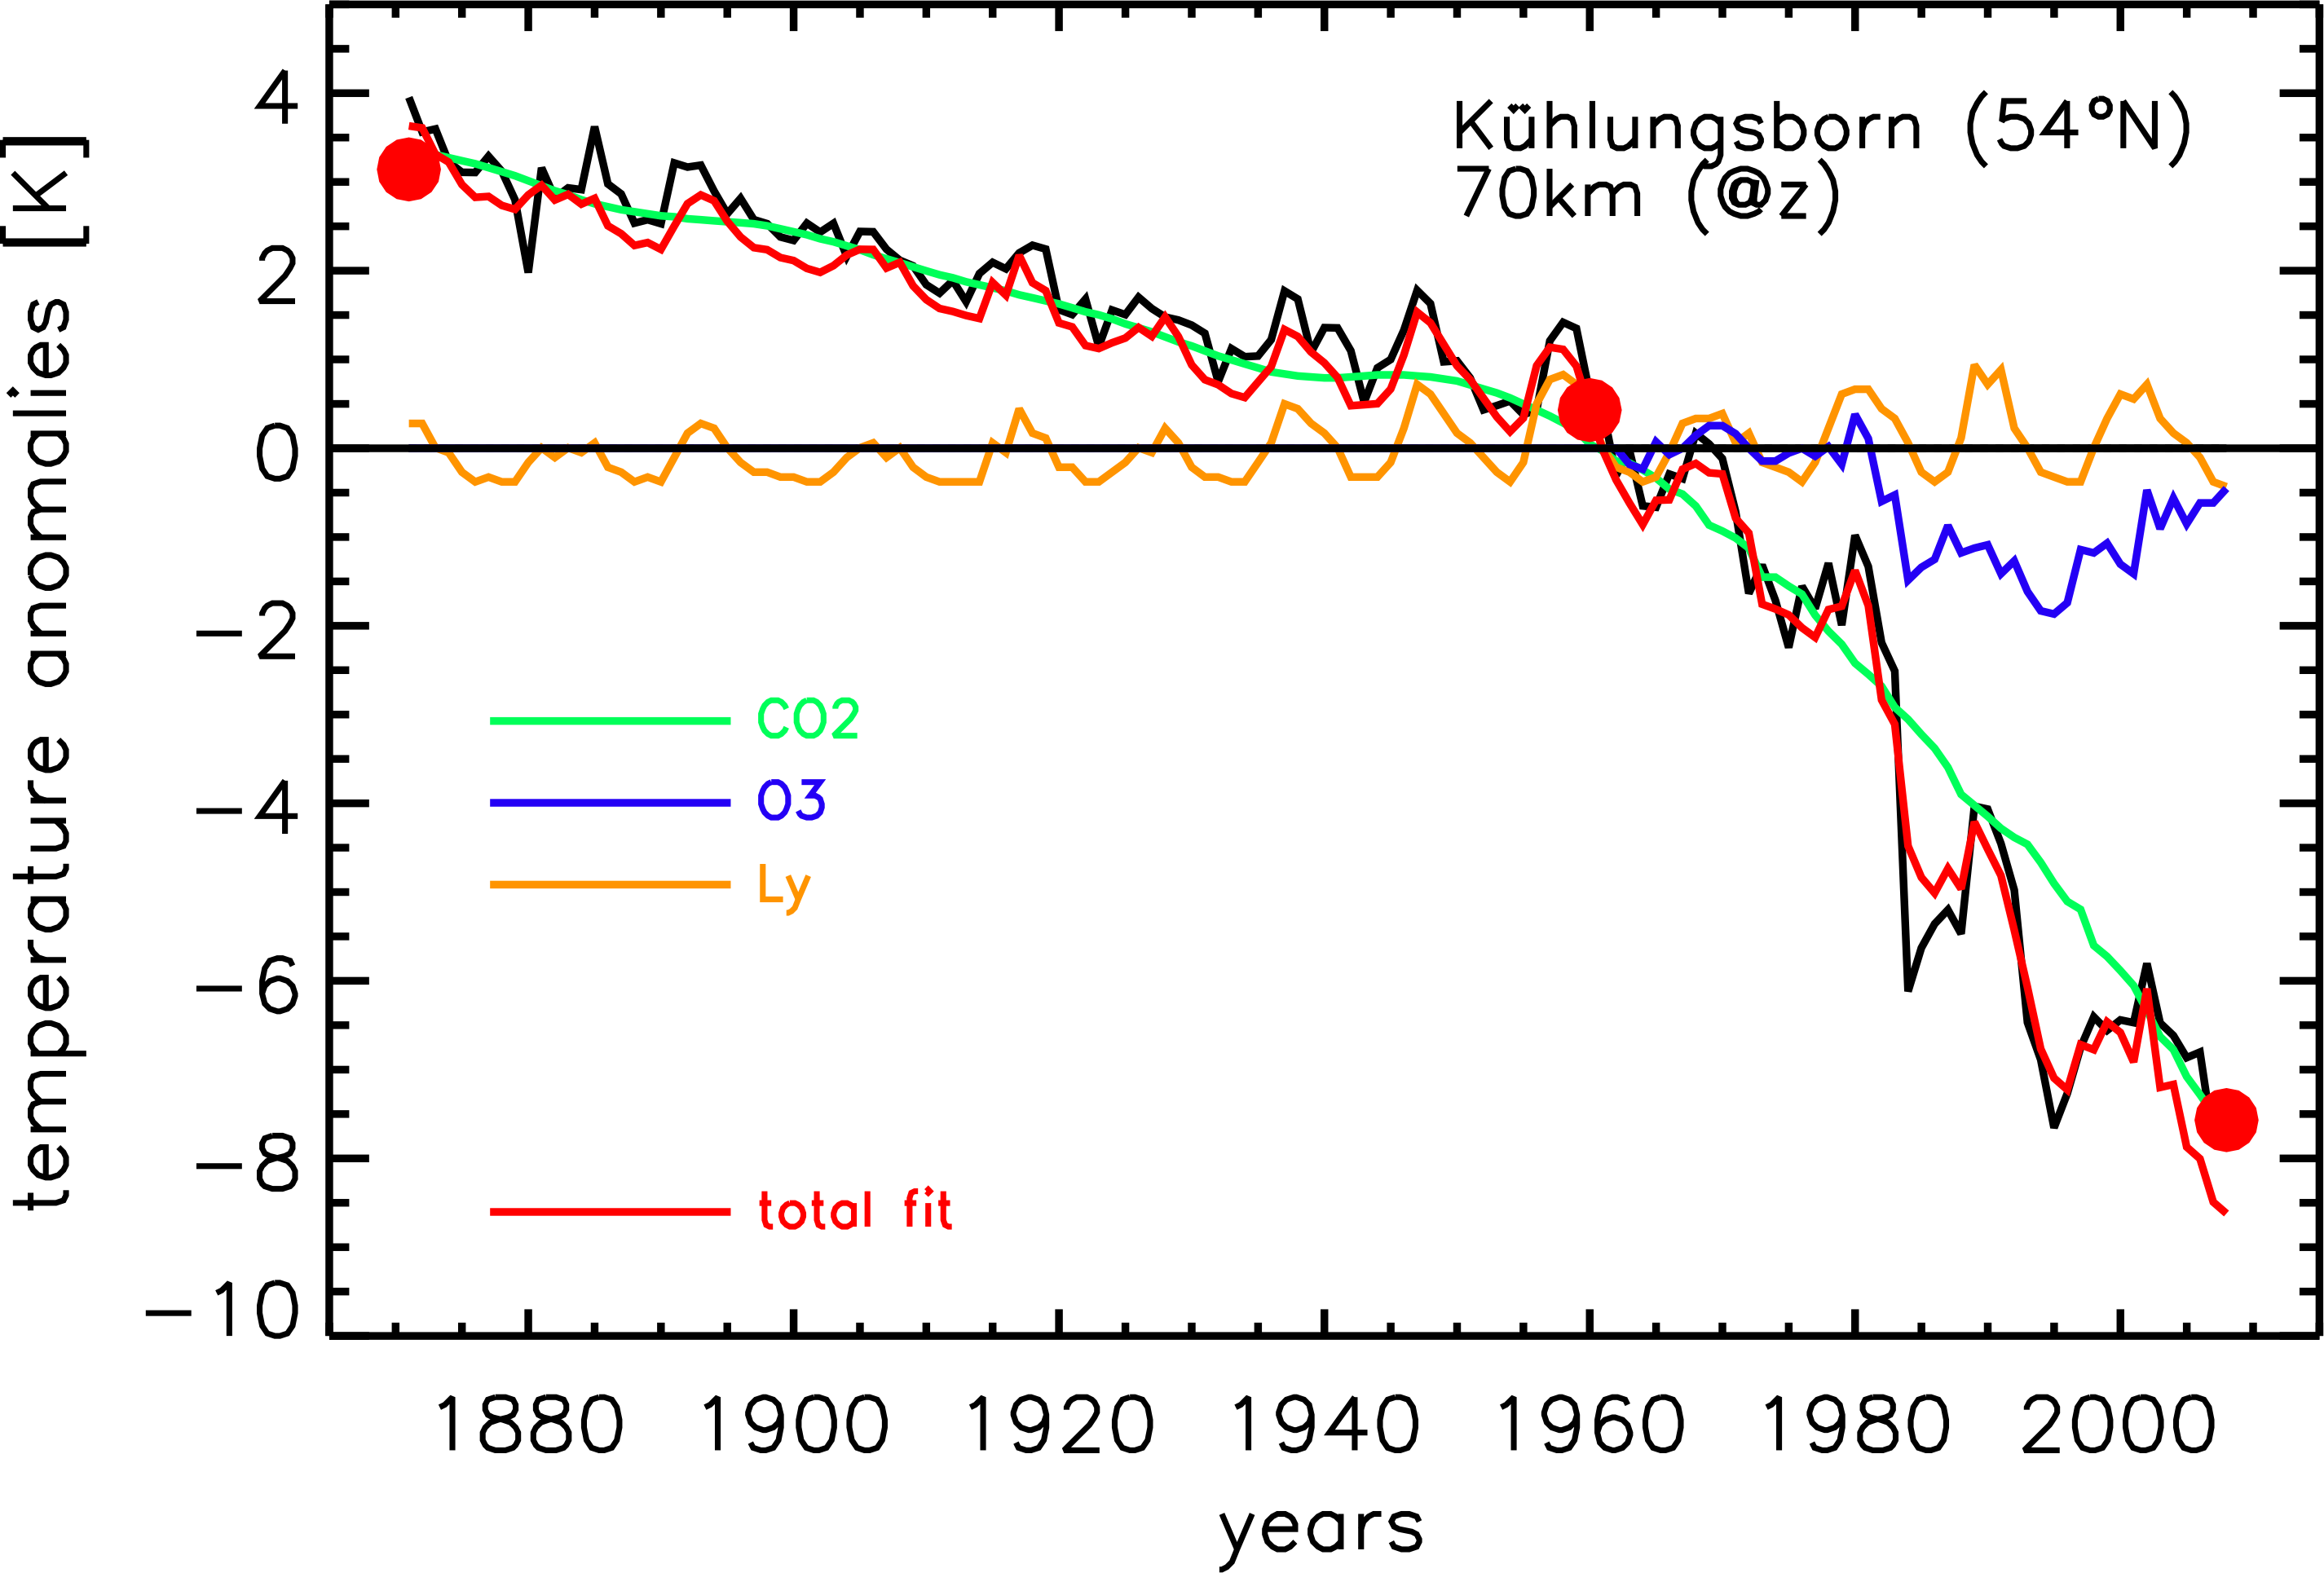
Fig.1: Temperature anomalies (=deviations from the June-August 1871-2009 mean) at zgeo=70 km at 54°N (Kühlungsborn, Germany) from 1871 to 2008 (black line). The result of a multivariate fit (red) consisting of CO2(t) (green), O3(t) (blue), and Ly-alpha(t) (orange) is also shown. Temperatures are marked at the beginning and at the end of the time series, and around 1960 where the trend changes markedly (red dots).
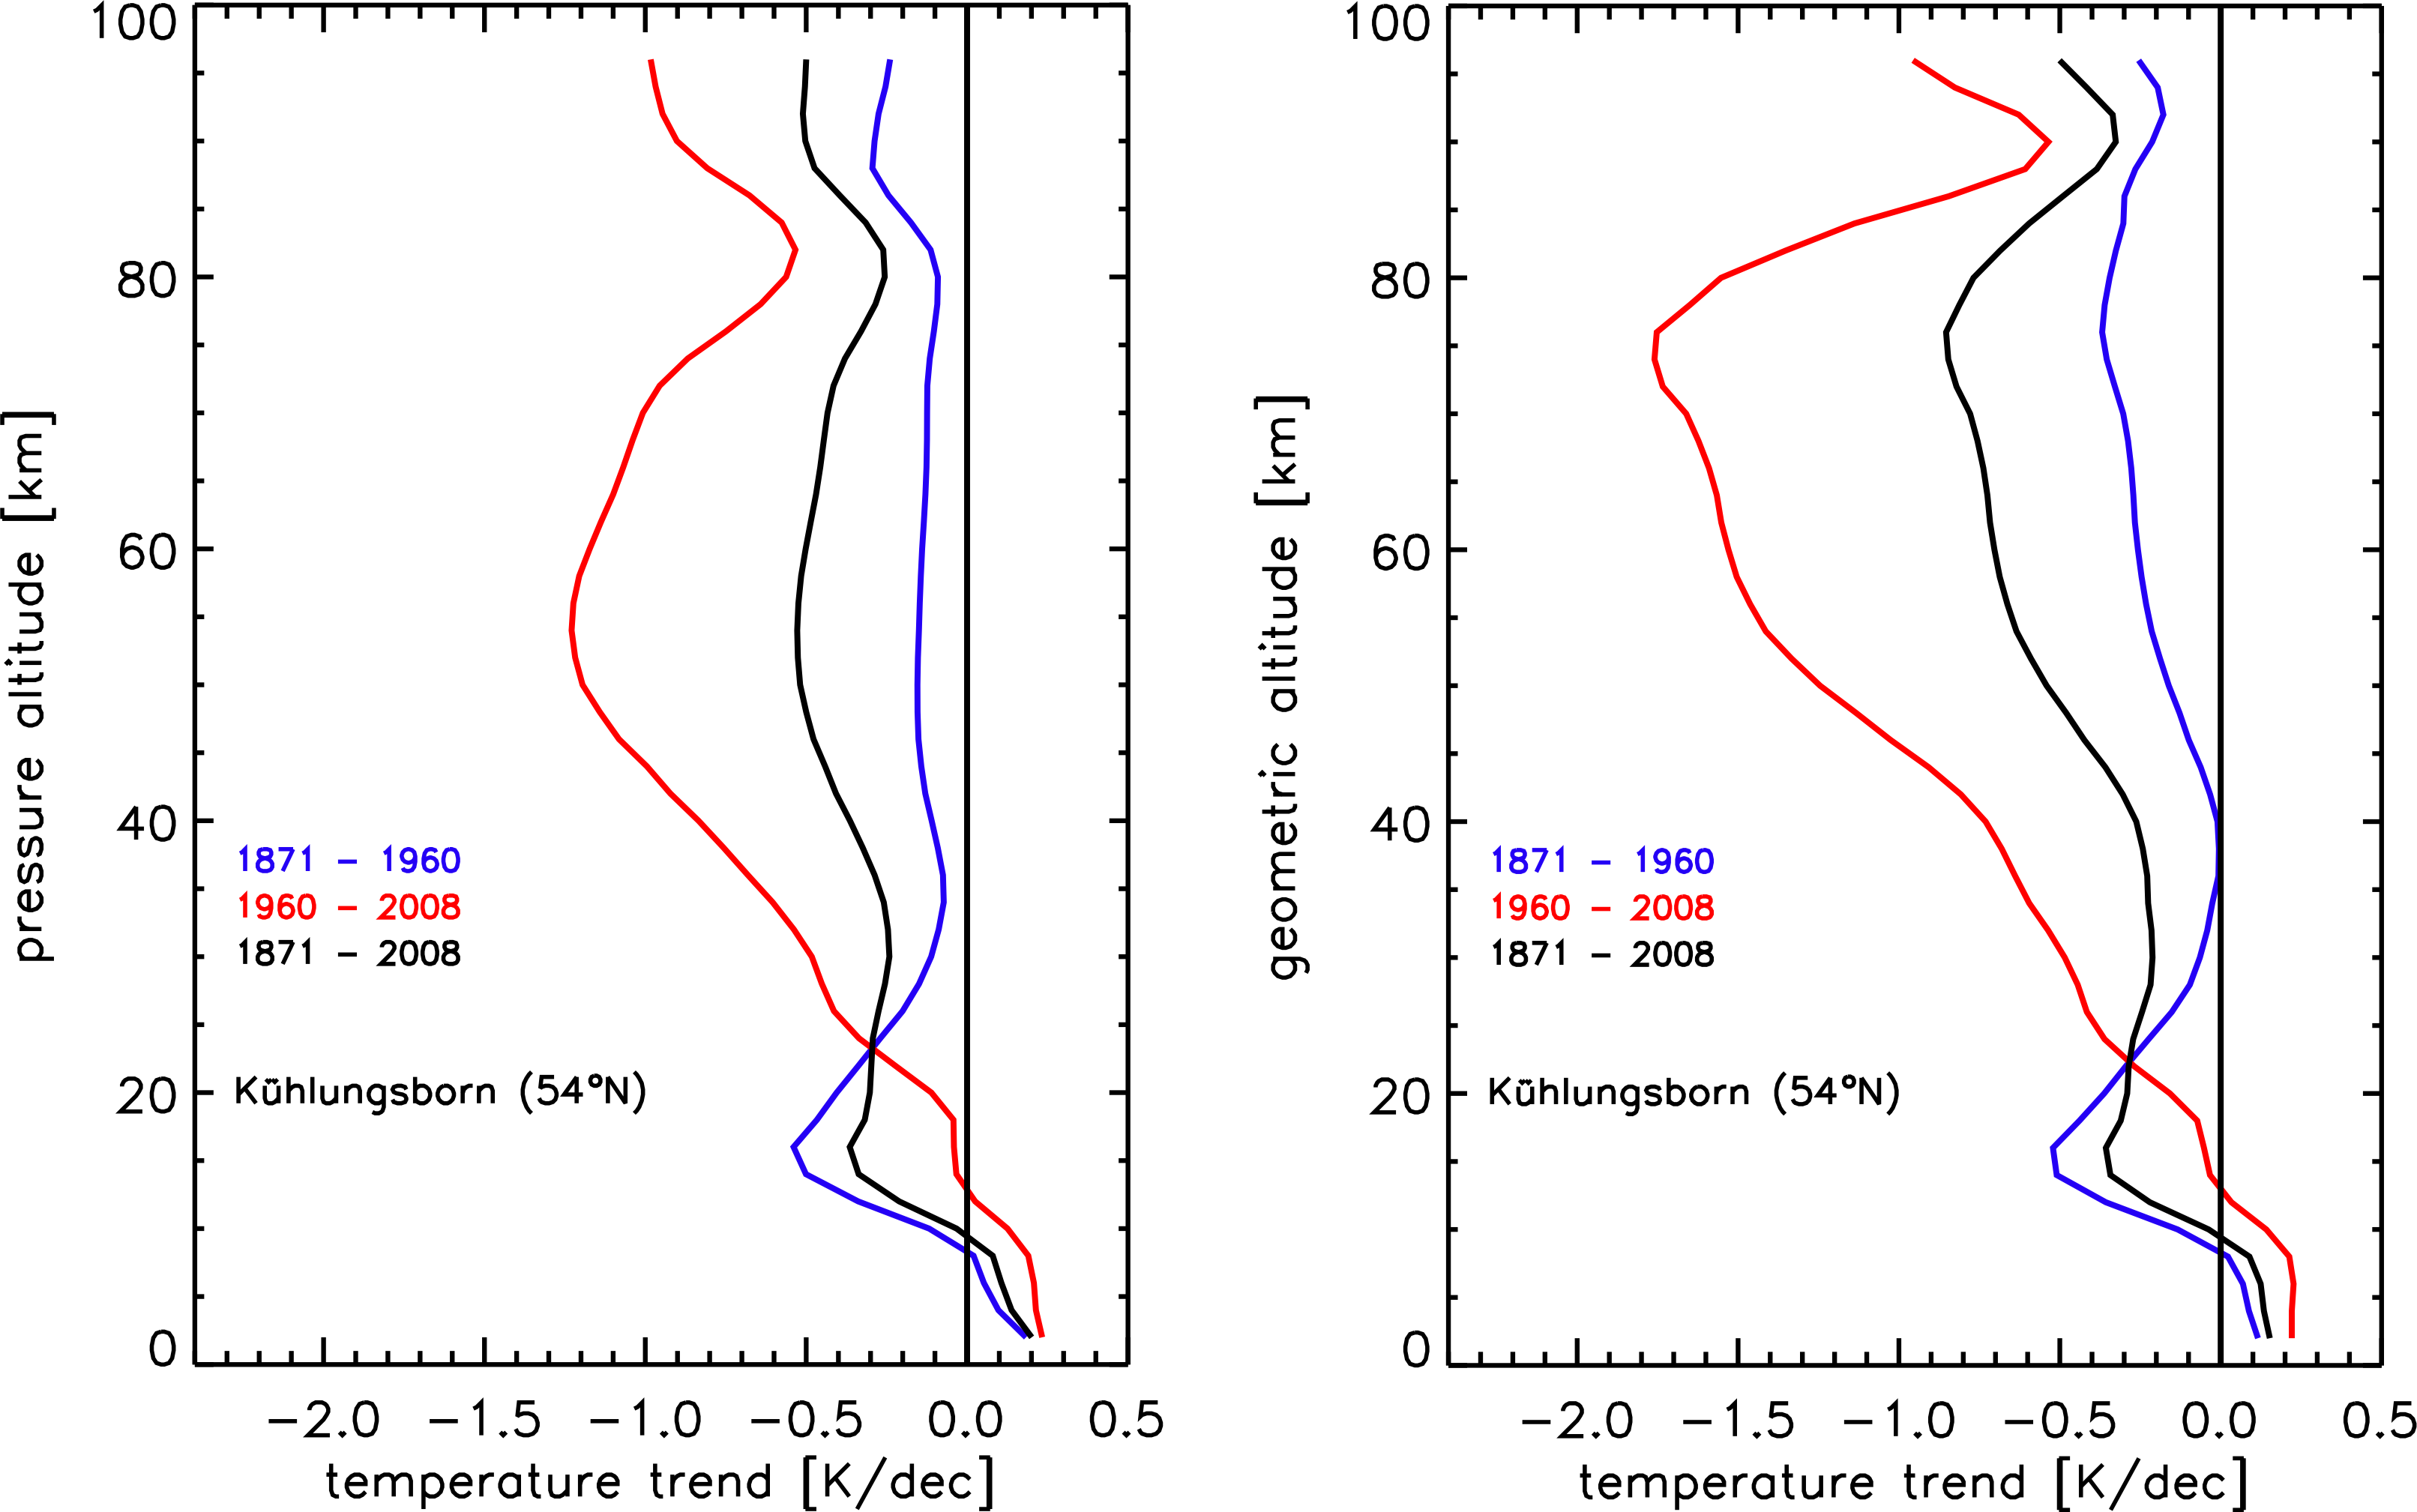
Fig.2: Temperature trends (June-August) for the location of Kühlungsborn 54°N) as a function of pressure (left) and geometric (right) altitudes. Black lines show the trend over the entire period (1871-2008), whereas blue and red lines show trends in the subperiods 1871-1960 and 1960-2008, respectively.
Potential biases from 20th Century Reanalysis nudging?