Brönnimann, S., and G.P. Compo, 2012: Ozone highs and associated flow features in the first half of the twentieth century in different data sets. Meteorol. Zeit., 21, 49-59, doi:10.1127/0941-2948/2012/0284 .
In order to better understand weather extremes, their relation to the large-scale climate variability, and their possible changes over time, observation-based atmospheric data sets are required that reach back in time as far as possible and that provide information on the 3-dimensional structure of the atmosphere. A number of new such data sets have been published in recent years, including historical observations, reanalyses, and reconstructions, some of which reach back into the 19th century. However, their usefulness for studying weather extremes remains to be shown. Here we compare some of these historical data sets in the first half of the twentieth century, focusing on one specific type of extreme, namely “ozone highs”. Using historical total ozone observations as a starting point, we assess dynamical links between total ozone, the flow near the tropopause, and tropospheric circulation in the “Twentieth Century Reanalysis” (20CR), historical radiosonde and air craft observations, and hand drawn historical maps. Selected cases are presented for two regions (Europe and China). Ozone highs over Europe in the 1920s to 1950s were qualitatively well reproduced in 20CR and could mostly be interpreted in the context of cut-off lows. Some of these coincided with a blocking high over the North Atlantic or with vigorous cold-air outbreaks. One of these cases is analysed in more detail. Ozone highs over China in the 1930s may have been related to changes in the jet stream and the subtropical tropopause, but they were not always well reproduced in 20CR. The results demonstrate that, in many of the cases, the available data allow a dynamical interpretation. This confirms the potential of the available data and techniques to extend the length of atmospheric data sets suitable for studying extremes.

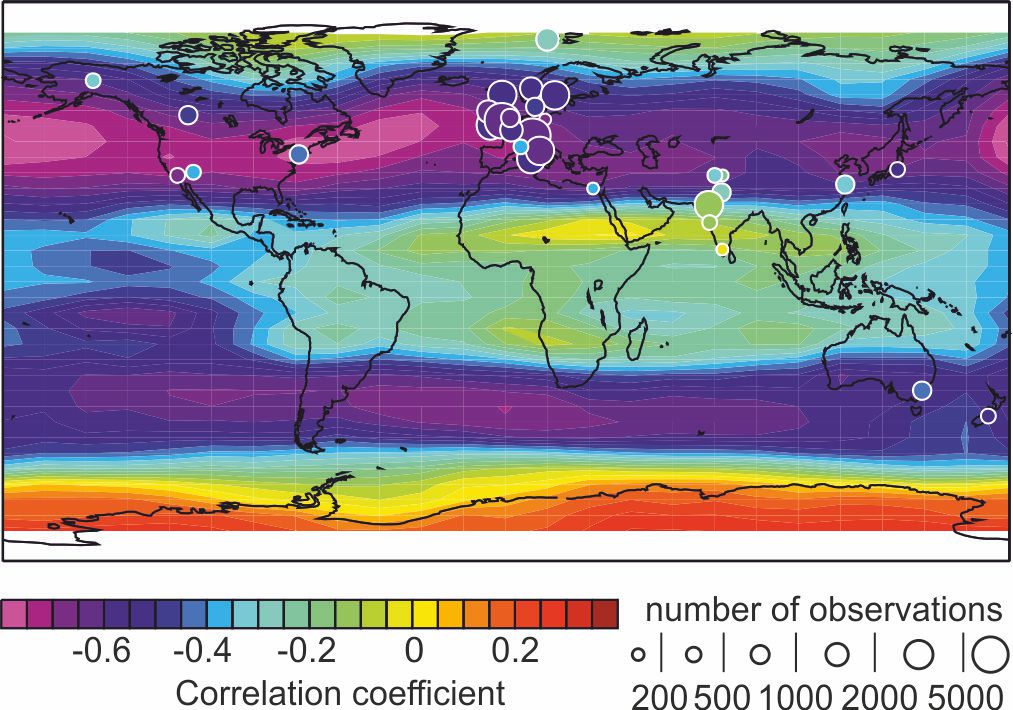
Anomaly correlations between 200 hPa GPH in 20CR and historical ground-based total ozone observations (1924-1963, circles) and between 200 hPa GPH in ERA-Interim and satellite-based total ozone observations (NIWA data set, 1997-2007, contours). The size of the circle indicates the number of observations. THe mean annual cycle has been subtracted from all seres.

Meteorological fields for two cases (top: 26 January 1934, bottom: 26 January 1936) with high observed total ozone at Zi-Ka-Wei, China, in the 1930s. (left) Hand drawn historical weather chart with sea-level pressure (mm Hg) and wind vectors, (middle) sea-level pressure (solid contours, hPa), ensemble spread standard deviation) of sea-level pressure (dotted contours, hPa), and winds at the 0.995 sigma level in 20CR, (right) total ozone (colours) and wind speed at the tropopause level (contours, in m/s) from 20CR. The coloured circles indicate the observed total ozone values.