Both observational and numerical studies suggest that fall snow cover extent over Eurasia is linked to subsequent winter variations in the predominant Northern Hemisphere teleconnection pattern, known as the Arctic Oscillation (AO). The present study uses the recent 20CR reanalysis to explore the snow-AO relationship over the entire 20th century for the first time. 20CR is first shown to have a consistently realistic simulation of the onset of the Eurasian snow cover compared to a large number of in-situ observations. It is then used to explore the snow-AO relationship over both the satellite and pre-satellite periods. Results show that this teleconnection is not stationary and did not emerge until the 1970's. The possible modulation of the teleconnection by the Quasi-Biennal Oscillation (QBO) is then discussed, as it could have favored the influence of snow anomalies on the Arctic Oscillation in recent decades. These results have important implications for seasonal forecasting and suggest, in particular, that statistical predictions of the wintertime AO should not be based on snow predictors alone.
Reference : Peings Y., E. Brun, V. Mauvais, H. Douville (2013) How stationary is the relationship between Siberian snow and Arctic Oscillation over the 20th century ? Geophysical Research Letters, DOI: 10.1029/2012GL054083.
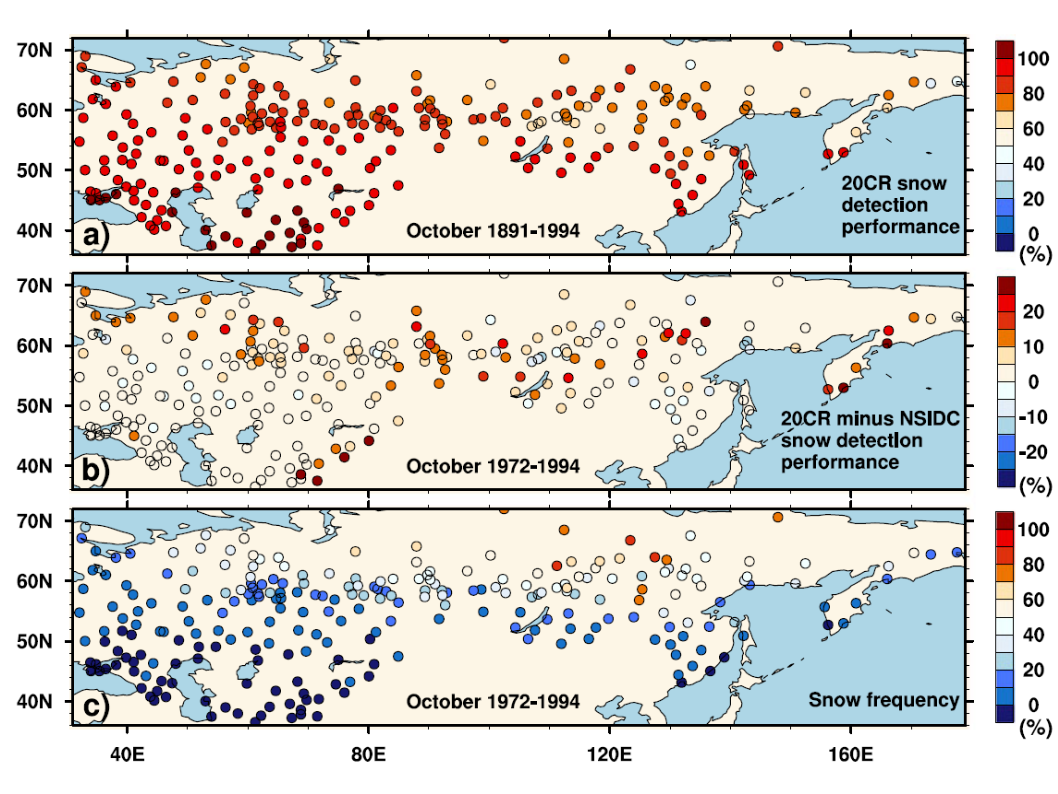
Figure 1. 20CR snow detection performance: percentage of October days with snow/no snow in both 20CR snow cover and HSDSD data (threshold 5cm) over 1881-1994. b) Difference in % between the 20CR and NSIDC snow detection performance over 1972-1994. c) Observed snow frequency in % of October days over 1972-1994, defined as the ratio of HSDSD data higher than 5 cm.
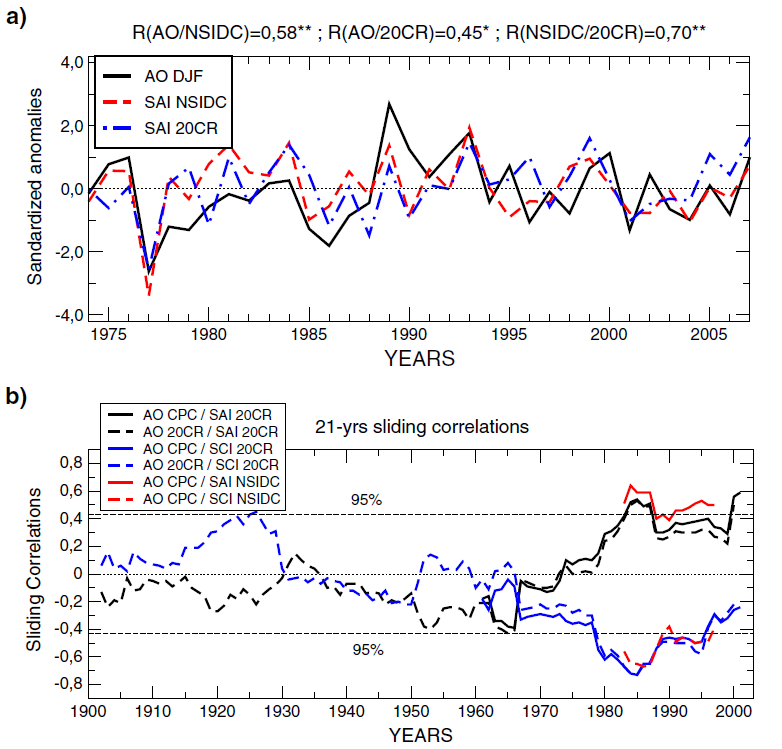
Figure 2. Timeseries and correlations for the following indices: AO-CPC ; SAI-NSIDC ; SAI-20CR from weekly data over the 1973/74-2006/2007 period. Stars indicate the significance of correlations : ** p<0.01 ; * p<0.05. b) Correlations on a 21-year moving window: AO-CPC vs SAI-20CR; AO-20CR vs SAI-20CR; AO-CPC vs SAI NSIDC; AO-CPC vs SCI-20CR; AO-20CR vs SCI-20CR ;AO-CPC vs SCI NSIDC. The 95% confidence level for correlations is indicated by the horizontal dashed lines. SAI-20CR is computed from daily data