In Part I of this ongoing series ( see 'Wondering why abrupt PNA shift evident in the Leathers and Palecki (1992) PNA is not apparent in semi-current (as of Oct 2009) NCEP NCAR reanalysis data (Part I)') my collaborator and I were trying to figure out why an abrupt shift in the PNA index in ~1957 pointed out by Leathers and Palecki (1992) (hereafter LP92) using older NMC reanalysis data was not found in more recent NCEP-NCAR reanalysis data. The main reason for this is that an abrupt drop in 700 mb Z over the southeastern U.S. (SEUS) that drove that PNA shift was evident in the NMC analysis, but not the NCEP-NCAR analysis. (see LP92's Fig1d and our Fig. 3d in Part I). To look at this more closely we decided to compare IGRA radiosonde variability ( http://www.ncdc.noaa.gov/oa/climate/igra/ ; Durre et al. 2006) for a number of SEUS stations during 1951-1965 with NCEP-NCAR 700 Z series at nearby grid locations.
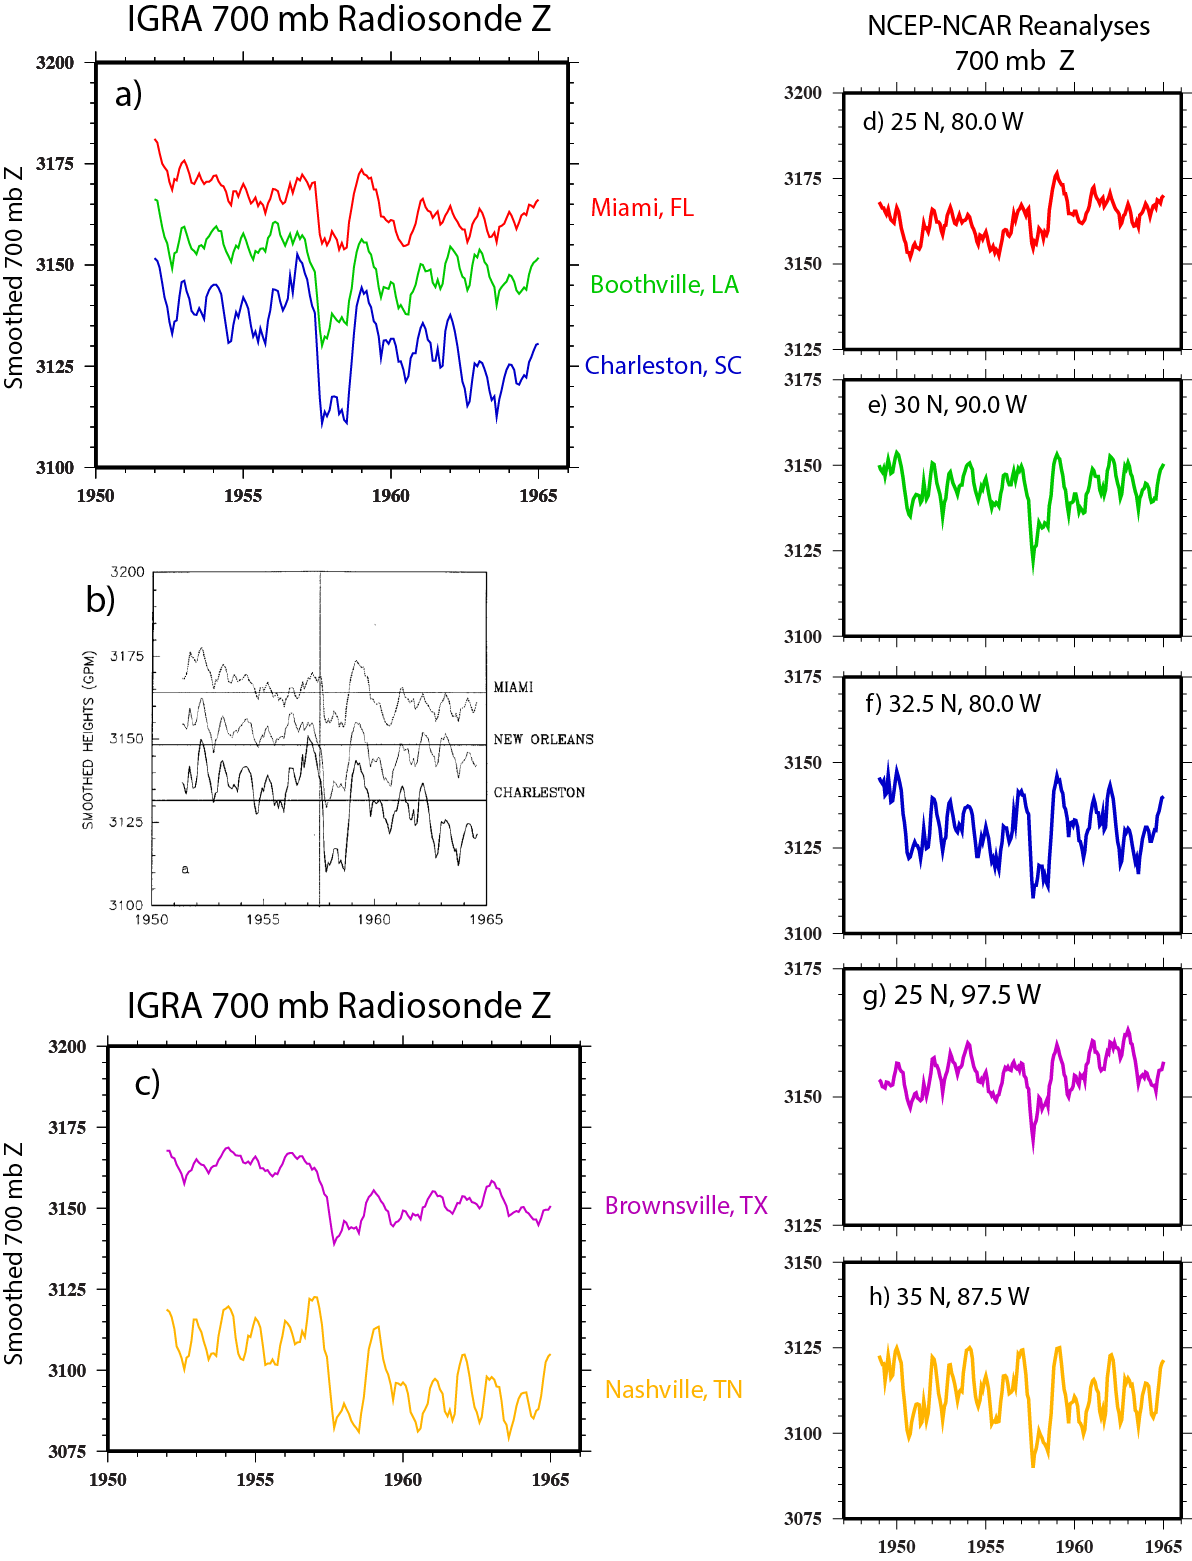
LP92 had looked at 700 mb Z variability derived from sonde data form New Orleans, Miami, and Charleston SC in their paper (see Fig 1b below), so we downloaded those station's data and data from a number of other SEUS stations. We averaged the IGRA daily data into monthly values, and subjected the monthly 700 mb Z from the IGRA and NCEP data to the same 13 month running average used in LP92. Comparing Fig1a below with Fig1b below shows that our Z series and their Z series for New Orleans, Miami, and Charleston are nearly identical. But while there is a downward shift in 700 mb Z after 1957 that LP92 show as a shift to below mean values in Fig 1b, that same shift is not evident in the NCEP Z series at nearby grid locations in Fig 1d,e, and f. For example, the NCEP Z series in Fig 1d has an upward trend after 1957, while the Miami sonde data in Fig 1 has a downward trend.
The differences between the sonde records for Brownsville TX and Nashville TN (Fig. 1c) and Z variation at the corresponding NCEP grid locations (Fig. 1g,h) are more obvious. Both of the sonde records show a clear regime shift to lower Z values after 1957 that is absent in the reaanalysis Z traces. Otherwise, the IGRA and NCEP trace are similar. For example, if you closely compare the IGRA Brownsville Z trace in Fig. 1c with the Fig. 1g NCEP Brownsville trace you see they closely similar, but that the NCEP values after 1957 are translated upwards. A similar translation also seems evident in the New Orleans, Miami, and Charleston NCEP Z traces (Fig. 1 d,e,f) , but is particularly clear in the Nashville IGRA and NCEP Z series (Fig 1c, Fig 1h).
It seems - and this is just a guess on our part - that NCEP Z values in the southeast US may have been nudged toward climatology after 1957. But this adjustment does not seem consistent with the downward trends and shifts in Z after 1957 in the sonde data. On the other hand, this shift is evident in the older NMC analyses (See LP92's Fig 1d in Part I).
Durre, I., et al. (2006). "Overview of the Integrated Global Radiosonde Archive." Journal of Climate 19(1): 53-68.
Figure 1